For many years, SIEM technology has provided a centralized, queryable log repository for security analysts to access information which would previously have been scattered across disparate tools. For an analyst to establish a fact-based account of activity, an incident timeline must be created whenever suspicious activity is flagged. Creating such a timeline is often a painful task, requiring expert knowledge not only of the SIEM tool itself, but also knowledge of what ‘normal’ looks like for the specific organization, and there are many potential pitfalls along the way. Understanding just which assets a user was accessing at the time of an event isn’t a trivial task, and things get even more complex when trying to map hostnames to IP addresses in a modern network. Ultimately, the exercise of building an accurate investigation timeline using manual log queries often takes a long time, and time is a precious commodity in security operations.
Today, Exabeam customers repeatedly tell us that our Smart Timelines has been revolutionary for their SOC analysts, as the automation of this work allows them to immediately get right to the heart of the investigation. And this got me thinking… How much time are we actually saving? So I decided to run a simulation, based very much on a real-world scenario, and the results were frankly staggering.
The tl;dr here is that to recreate just one reasonably straightforward malware alert investigation timeline, it would take over 20 hours of a seasoned analyst’s time. It’s not a nation state-level attack timeline, including complex low and slow maneuvers, months of reconnaissance, hand-crafted exploits, or anything vaguely of that type. A fairly standard malware alert investigation = over 20 hours.
Life before Exabeam
Before joining Exabeam, I led cybersecurity operations for a company with 10k employees and a global presence, but my security team had a staff of only five analysts. Like many orgs, we served as cybersecurity analysts, investigators, architects, and liaisons.
Since all security analysts acquire different levels of tribal knowledge inside their organization as to which activities are deemed normal or abnormal, quality control is essential. With this in mind, during training I stressed to my team that if anyone was going to make an assertion, they had to substantiate that in at least two ways. Three is even better.
So, I know first hand that manually assembling an incident timeline using a traditional SIEM is a labor-intensive process requiring numerous queries. This article takes a look at just how laborious the process truly is. We’ll wrap up in the second article of the series by seeing how Exabeam automates the entire process while including critical information the manual process misses all too often.
Asking the question: what is the baseline for normal behavior?
The question in any security matter amounts to this: “To establish a chronological timeline of events, what queries do I need to run in my SIEM to substantiate each event is an accurate portrayal of a given user’s activity?” In Figure 1, for each alert/event we had to manually connect the dots before moving on to the next alert/event. Our task was to try to summarize the most relevant information.
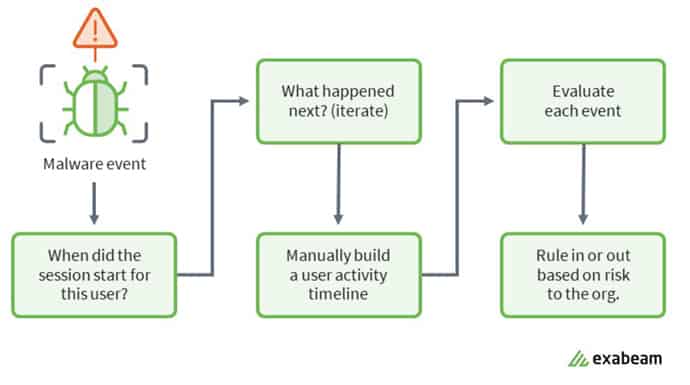
Figure 1: Example of the workflow an incident response analyst follows.
Most of the time it’s difficult to make sense of the logs as more questions and possibilities arise:
- Is it normally OK for the user to have such access?
- Is that activity consistent with that user’s job function?
- Is this activity consistent with the way the user normally interacts with the system or app?
Without any context, it is a major challenge trying to draw conclusions from such a huge stack of raw data.
Different paths often don’t lead to the same truth
Investigating threats and evaluating risks manually is very time-consuming and prone to errors. And analysts who pore through all this data will have their own biases, following a path that makes sense to them. It’s been my experience that when you assign the same incident to two analysts, you’ll end up with two different outcomes—and that’s not good for the credibility of your security operations team.

Figure 2: Analysts have many questions to answer when investigating an event–this sample shows 51 such questions.
Simulating a manual investigation
I recently conducted a simulation of a legacy SIEM platform to illustrate the inefficiencies of performing investigations through manual pivots and queries.
For an analyst’s skill level within the organization, I assumed a moderate level—one who has a basic understanding as to what is abnormal, which apps users use, who should be using which resources, knowledge of current attack vectors, and where to check on the reputation of potential threat indicators (domain/IP reputation, file reputation).
I chose a relatively well-tuned environment, where query data is returned reasonably quickly. This certainly wasn’t the case years ago when the technology wasn’t as good as it is today.
The reality may be that an enterprise has a poorly-tuned environment, gaps in visibility due to inadequate log ingestion, and/or insufficient staffing to monitor around the clock, all of which can significantly impact detection and response times. There are a host of variables and metrics which should be assessed, including:
- Does the organization have a SOC?
- Does it have staff monitoring security events 24x7x365?
- What does their response time typically look like?
- Are those who are monitoring only part-time or is that function outsourced?
- What are the MTTD (mean-time-to-detect) and MTTR (mean-time-to-respond) in these cases?
- Is this tested regularly through pen testing, red-teaming or other simulations?
- Is the SIEM maintained (tuned) appropriately to return the necessary info quickly?
- What is the SLA for returning queries over the last 30/60/90 days?
- Does the security budget account for ongoing SIEM maintenance?
We often see that gaps in security lead to big data breaches. This adage remains true: “Defenders have to catch every incident, whereas attackers only have to succeed once.” To this point, the biggest risks lie in the gaps in coverage which requires extreme diligence and focus on closing known gaps, as well as pushing the security and broader IT teams to identify previously unknown gaps.
In many cases when an analyst investigates a given incident they learn its scope was much larger than previously thought. Often digital forensics uncovers evidence of lateral movement or other types of persistence. Only then is it discovered that the initial compromise didn’t just start within the last six months—the breach had been ongoing for years.
Building the assumptions
In a production environment, a system can easily execute 200-400 processes in any given day—or perhaps even into the thousands for a heavy user. Using the 200 estimate, an analyst would likely apply the 80/20 rule. That is, they can probably safely explain why 80 percent of those are occurring and easily run a few searches to validate and quickly rule those out. Still that leaves about 40 process executions that need to be investigated in more detail by the analyst.
To build the incident timeline required to explain the full chain of events, in a legacy SIEM environment, this required 96 disparate queries. Each query ended up averaging 12.9 minutes to execute and analyze the returned results, for a total of 20.64 hours—substantially longer than any one person’s typical workday. This means there is a handoff of findings across analyst shifts, which introduces the potential for some of the knowledge gained during the investigation to be lost in this transition.
In this simulated attack sequence, the user that stood out was Frederick Weber. In a real-world investigation, we’d want to determine if he’s really driving the activity seen in his account, or if this was an attacker using Weber’s account. On the flip side, if the incident does point to Weber, could this be an insider threat, where he’s getting paid or being coerced by an outsider? Done manually, it’s really difficult for an analyst to reliably detect deviations from normal activity over large datasets. This is very tedious work and error-prone.
Focusing on Weber’s simulated timeline, I set up short-term search queries in my first tab (Tab 1) and longer-term queries in my second tab (Tab 2), allowing me to more quickly toggle between comparisons of Weber’s activities to historical norms for the user (Weber) and the organization as a whole.
I then extrapolated some conclusions from our simulated environment.
Stitching the timeline piece by piece
I started by looking at conhost.exe, a host process Weber was running as shown in Tab 1 (see Figure 3). Flipping over to Tab 2 and looking at the time frame from March – May, I saw 1,243 entries for conhost.exe. For this sort of human analysis, my interpretation might be that it’s normal for conhost.exe to frequently appear in my environment. I may not be concerned that it’s malware or that an attacker is leveraging it.

Figure 3: Tab 1 showing short-term timeframe search for
conhost.exe process execution activity for subject Frederick Weber.Not knowing for certain, I check in with a SOC team member about conhost.exe. He suggests looking at peer group usage—Frederick Weber is a member of the web developer group. I see he is not the only person in his peer-group to run conhost.exe during the two-month time frame shown (see Figure 4).
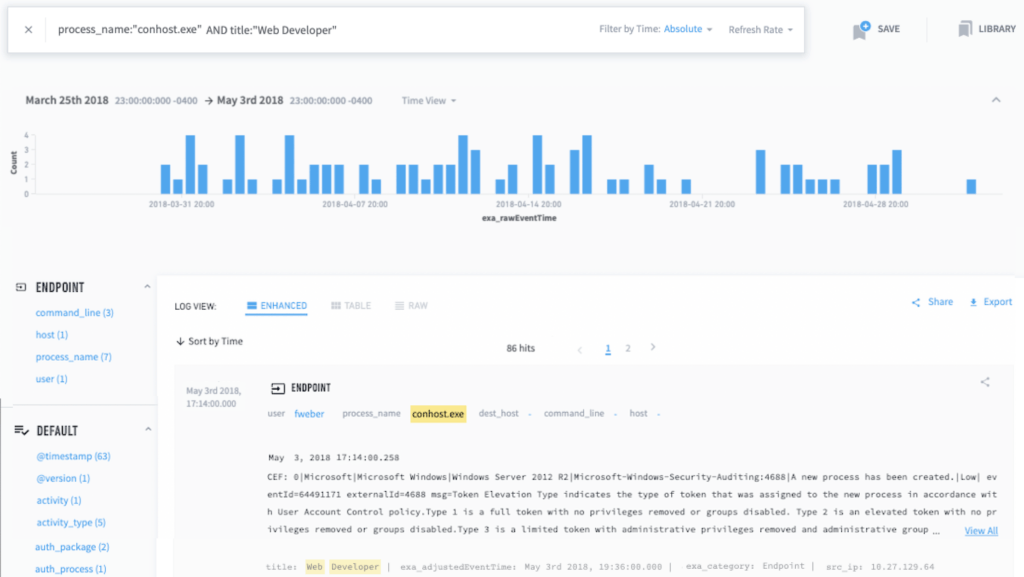
Figure 4: Tab 2 showing the long-term timeframe search for conhost.exe process execution activity for Frederick Weber’s peer group.
So conhost.exe is the Console Window Host which runs any time a user opens a command prompt window. It would be up to each analyst to know that and I’d expect it to be run by many users, not just Weber.
At this point we’re approximating what an analyst might know in this simulation with the limited test data. And so with the clock still ticking, here I determine conhost.exe is merely a false positive.
But what is barbarian.jar in Tab 1? And why does it only have one hit across a two-month timeline in Tab 2? Other than Weber, it appears no one in my environment has previously run this file. This is clearly anomalous and warrants further investigation.
Phew. Let’s pause here. In my next article I’ll cover how to build a timeline from disparate logs and evidence, the questions to ask, and how you can use a reliable and automated system to create timelines for investigation.
Want to learn more about what Exabeam can do?
Have a look at these articles:
Similar Posts
Recent Posts
Stay Informed
Subscribe today and we'll send our latest blog posts right to your inbox, so you can stay ahead of the cybercriminals and defend your organization.
See a world-class SIEM solution in action
Most reported breaches involved lost or stolen credentials. How can you keep pace?
Exabeam delivers SOC teams industry-leading analytics, patented anomaly detection, and Smart Timelines to help teams pinpoint the actions that lead to exploits.
Whether you need a SIEM replacement, a legacy SIEM modernization with XDR, Exabeam offers advanced, modular, and cloud-delivered TDIR.
Get a demo today!

