
-
- Home
>
-
- Blog
>
-
- SIEM Trends
An Incident Investigator’s Cheat Code
- May 28, 2020
- Anthony Randazzo
- 6 minutes to read
Table of Contents
Most SOC analysts you ask, including me, will tell you their preferred tools of the trade are EDR (endpoint detection and response) tools.
There’s a reason for that: 70% of all compromises still originate at the endpoint, and EDR tools provide the endpoint detection and recording capabilities that security analysts need to tell the story of what happened.
But telling that story is time-consuming because of the abundance of data recorded by the EDR. And EDR telemetry doesn’t account for all the other security signals available to analysts across the network like cloud infrastructure and apps. All those signals are important to help an analyst figure out what’s going on.
Have you ever timelined Windows event logs using Excel? Yeah, me too. It’s painful. EDR tools are great at finding evil but they aren’t necessarily your go-to source if you have to track a bad guy using a stolen credential across a 100K-node environment.
Now, EDRs aren’t perfect. They won’t detect everything. This is why defense-in-depth strategy is so critical.
So how can we get some insight into all security signals in a single, intelligible view?
Well, many of our customers use Exabeam for exactly this purpose.
Why Exabeam?
Exabeam Advanced Analytics detects threats by identifying high risk, anomalous user, and entity activity. This happens by using machine learning to baseline normal activity for all users and entities in an environment. Once a baseline is available, the system automatically detects deviations compared to that baseline, the baseline of a peer group, and that of the organization as a whole—and assigns that activity a risk score.
Each time a rule fires, the system accumulates a risk score for that user or entity session (roughly one day of activity). Once the risk score reaches a threshold, you’ll get a Notable User alert. From the alert, you can investigate the user’s session, which contains all of the recorded events and triggered rules.
Anomaly detection can be synonymous with snake oil in the security marketplace. But that’s not the case here. Exabeam stitches together all of our defense-in-depth security signals to provide a comprehensive view of what happened. Here are some examples of how Expel uses this insight to tell us things we didn’t know and possibly wouldn’t have known without a tool like Exabeam.
Quick and dirty incident timelining when you need answers fast
When we identify a security incident, it’s often a time-consuming effort to collect all of the data necessary to put together a comprehensive timeline (Windows Event Logs, EDR events, authentication logs). To be honest, we’re going to do it anyway to ensure we don’t miss anything. But we also strive to provide answers to our customers as quickly as possible.
For example, Expel recently responded to an incident where an attacker was already on an endpoint. The attacker attempted to escalate privileges with PowerSploit. The customer’s EDR alerted on this activity but not the initial compromise.
With this incident, we’d ask the following general investigative questions and expand from here:
- What did the attacker do on this host?
- Did the attacker move laterally to any other hosts?
- Did the attacker have access to any other accounts?
- How did the attacker get into this environment?
Traditional response scoping requires us to collect, parse, and review the EDR events and Windows Event Logs (assuming it’s a Windows compromise), and then pivot to other data sources once new leads are identified.
Or we can simply review the user or entity timeline in Exabeam.
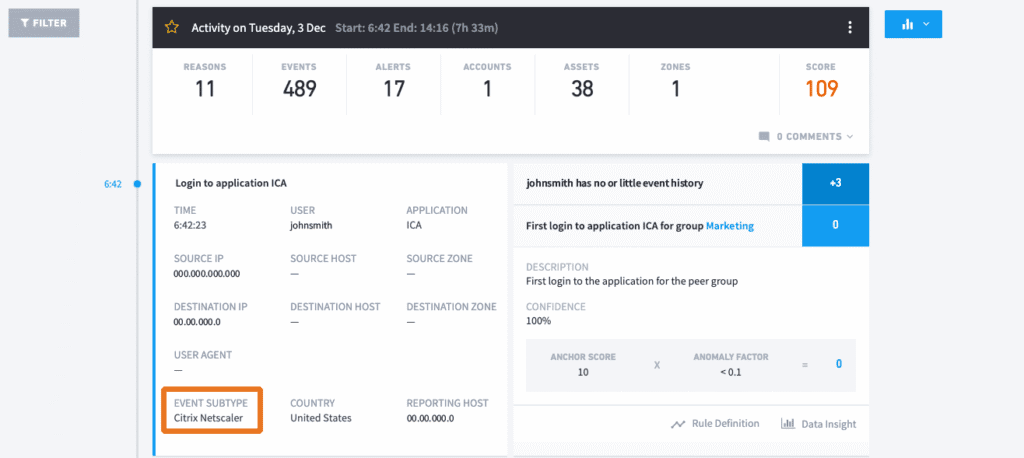
Now, thanks to Exabeam, we can identify that the attacker gained initial access to the environment with compromised credentials through the Citrix Netscaler VPN. Fortunately for us responders, the user had little activity in the session so we easily attributed all of this activity back to the attacker. The authorized user wasn’t on the network at the time to inject authorized user activity into the timeline.
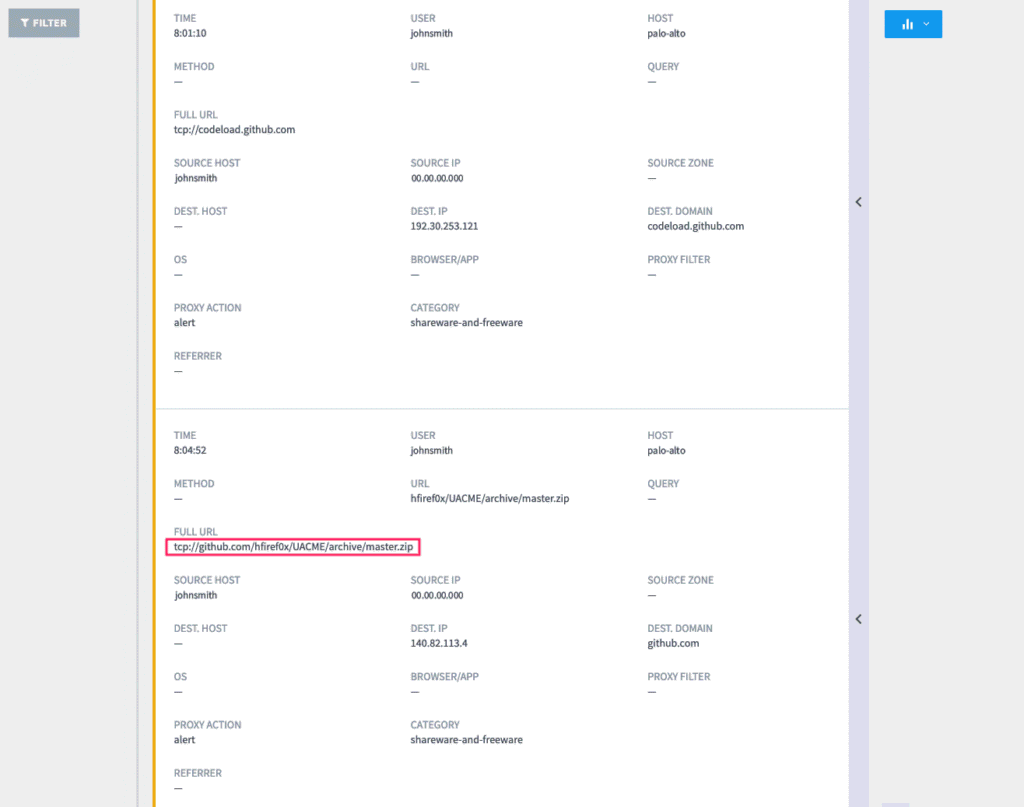
Moving down the timeline, we see the attacker accessed the published VDI from which we’d received the original EDR alert. We also have the user’s web activity stitched into the Exabeam session and identified that the attacker moved staging tools on the VDI directly from Github.
Lastly, we see the actual EDR alerts stitched into the session timeline where the PowerSploit script was blocked from executing by the EDR.
Without even looking at the EDR data, we answered all of our investigative questions with relative accuracy through Smart Timeline.
What did the attacker do on this host?
- He or she downloaded various post-exploitation tools to escalate privileges, which were blocked from executing by the EDR.
Did the attacker move laterally to any other hosts?
- With the Windows Event logs stitched into the session, we can see there was no other access to the environment with this user account.
Did the attacker have access to any other accounts?
- This question is a little trickier to answer because we’re only reviewing a single user session in Exabeam, but we can infer that the attacker was limited to this single account since he or she was isolated to a single provisioned VDI.
How did the attacker get into this environment?
- We quickly discovered authenticated access into the Citrix environment via Netscaler VPN, a task that would’ve taken analysts hours to identify with manual response scoping through raw data.
Visibility into activity that didn’t set off alarms in your EDR
Identifying everything an attacker did within the timeframe of when an incident occurred is challenging enough for analysts and responders. In the example, we showed there were some nuances and lengthy processes involved in endpoint incident response. There are potentially millions of endpoint events occurring every day. This is a lot of data for humans to comb through to timeline an incident. What if an incident spans several days, weeks, or even months?
Here’s an example: Expel responded to an intrusion first detected by an EDR due to an attacker’s deployment of a Cobalt Strike Beacon backdoor. Further analysis of the endpoint revealed the attacker performing reconnaissance of the network and Activity Directory (AD) environment with various open-source tools.
Reviewing this user’s sessions in Exabeam gave us lots of insightful data. All activity identified through host response from EDR data was validated in the Exabeam timeline: the EDR alert was preceded by various recon activities. Like the previous compromise example, this authorized user had limited network activity and the only previous session occurred 20 days earlier.
Interestingly enough, that earlier session revealed the attacker was active in the environment; he or she was performing the same recon activities. However, because the activities performed by the attacker during this previous session didn’t warrant an accumulated risk score, Exabeam didn’t generate an alert. More specifically, the attacker didn’t execute the Beacon PowerShell activity that originally brought this to Expel’s attention, thus no EDR detection occurred for the earlier session. (More on this momentarily.)
Exabeam proved highly valuable in identifying attacker dwell time in an environment — something that might not always be apparent with EDR technology. EDR data retention is sometimes limited for endpoints and varies and ranges from storing up to a month of data to as little as several hours’ worth depending on the technology. Traditional IOC scoping, especially with compromised VPN/AD credentials, may not reveal an attacker.
Putting it all together
Exabeam is a machine learning (ML) technology and, like any ML technology, it requires a little TLC. If you take the time to tune it, you can get some incredible benefits from it.
Here are the top three tricks we’ve learned about Exabeam:
- Send the right data to Exabeam. Windows Event Logs, authentication logs (all of them!), web gateway logs and security events (EDR, AV, NSM, etc.) are a great start.
Pro tip: anomaly detection of Windows process execution (Windows Event 4688) by users is awesome! Exabeam provides hundreds of data parsers natively to consume just about any data that’s thrown at it.
- Modify the rule risk scoring based on your organization’s risk posture. Default risk scoring isn’t a one-size-fits-all approach to measuring risk in an organization. Is insider data theft your org’s biggest concern? Increase the risk score for those rules. The process execution example below is one I’d personally opt to boost.
- Don’t introduce new, high-volume data sets too quickly that greatly impact the data models (especially web gateway logs). Allow the system to learn on its own for a period of 45 days before enabling the ruleset and leveraging it as a production tool. When you add a bunch of new data to an existing model, all of that new data becomes an anomaly. And you don’t necessarily want that. If you find yourself in this position, pull back the risk scoring for those affected rules down to zero until the data models catch up (or consult with your Exabeam partner for help).
And here are some other points to consider if you’re thinking of investing in a tool like Exabeam:
- EDR isn’t going to catch everything, particularly the anomalous use of credentials. Anomaly detection platforms like Exabeam can excel in this department. Keep in mind that UEBA platforms do require a certain amount of supervision to keep the false positives at bay, but you’ll have a better chance of surfacing up something that your traditional security tools might not catch.
- Incident response is time-consuming. There’s a lot of data to sift through to paint the full picture of what happened after an incident occurs. UEBA platforms like Exabeam do a rad job of helping stitch all of that user or entity context together to provide you with a comprehensive timeline of attacker activity.
Editor’s note: the original article was published in the Expel blog.
Want to learn more about what Exabeam can do?
Have a look at these articles:
- How to Use Exabeam for Threat Hunting
- Advanced Analytics Use Case: Detecting Compromised Credentials
- Recreating an Incident Timeline–a Manual vs. Automated Process, Part 1
- Recreating an Incident Timeline–a Manual vs. Automated Process, Part 2
- IT Security: What You Should Know
- Detecting Lateral Movement and Credential Switching: Human vs. Machine
- Penetration Testing: Process and Tools
- Tags
- About Exabeam
Learn More About Exabeam
Learn about the Exabeam platform and expand your knowledge of information security with our collection of white papers, podcasts, webinars, and more.
-
 Blog
Blog
Five Ways Exabeam Delivers Better Detection and Security Outcomes Than Microsoft Sentinel
- Show More

