User Entity Behavior Analytics (UEBA) analyzes log data from different sources in order to find anomalies in users’ or entities’ behaviors. Depending on enterprise sizes and available log sources, data feeds can range from tens of gigabytes to terabytes a day. Typically, we need 30 days, if not more, to build proper behavior profiles. This calls for an analytics platform that is capable of ingesting and processing this volume of data. In this blog, I describe a security analytics use case, its algorithm, and why we at Exabeam leverage a distributed computing platform based on HDFS and Apache Spark to implement it.
The use case is to identify user’s abnormal behavior in his or her periodic activities. This is one of my favorite use cases from some years ago and is still one now. The motivation is to measure how different a user’s activities today are compared to his or her history. Users on a network generate volumes of Active Directory (AD) events on a daily basis. Over a long period of time, say 30 days or more, each of the users would have enough data to establish his or her own behavior pattern based on the event types and their volumes generated. Once the normal pattern is learned per user, we can evaluate whether a user’s activities on a new day is consistent with the learned pattern. An anomaly is triggered if the new day’s activities cannot be explained by what was learned.
This simple idea extends to many different scenarios. For example, instead of just learning patterns of AD events, we learn patterns of applications users access in the cloud, or of assets users accessed on the network. So, how do we actually do it with machine learning?
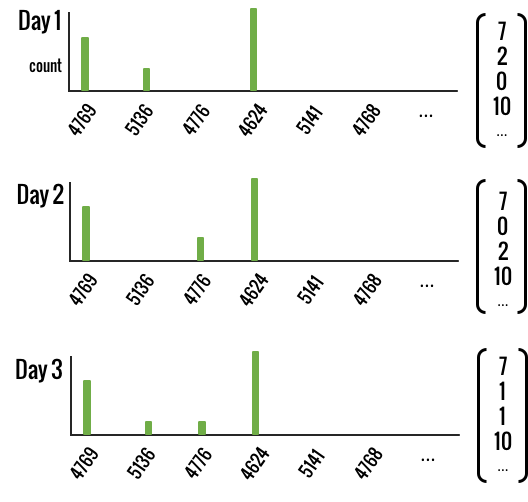
On an historical day for a user, the user’s behavior can be represented by a vector of counts, each representing the number of times a specific AD event such as 4769, 4624, etc. is observed. In representing the daily activities like this, we can completely capture the user behavior data by a collection of (daily) vectors. If there are D unique AD events, the size of the vector is D. The size of the collection is number of historical days. See figure 1.
 Figure 1. An illustration of three daily behavior vectors
To extract patterns out of the collection of historical daily vectors, a good first choice is to use the old fashioned Singular Value Decomposition (SVD). For those of you who are unfamiliar with this term, SVD is a dimensionality reduction technique. Let me explain it in layman’s terms:
Data with high-dimensionality has large number of attributes or features. It is often desirable to extract out only the most informative lower-dimensional signals from high-dimensional data to reduce the noise level in modeling. SVD offers such a technique. Imagine a 3-dimensional object like your hand, which can be manipulated to be held in a variety of ways. You can find the best angle to shine a single-point light on this 3-dimensional object to reveal an informative shadow on the wall, a 2-dimensional object. The projected 2-dimensional space is said to capture most of the information that the data in the original higher dimensional space has. Similarly, SVD finds the best angle in which to shine light in order to project our high dimensional data (a collection of historical D-dimensional vectors) to a lower dimensional space to reveal the most informative pattern for representing the original data.
 Figure 2
How do we use this learned lower dimensional representation for anomaly detection, then? In Figure 2, the optimal angle of light on the hand gesture revealed a rabbit (looks like a rabbit to me). If we keep the same angle of light, but now see the shadow change shape into some nameless shape, then we know the hand position must have changed. How do we measure the degree of anomaly? We can now reconstruct the data from shadow (a lower-dimensional data) back to what we believe as the hand (a high-dimensional data) that generated it. This reconstruction step allows to compare the difference between the true observed hand and the reconstructed hand; that is the degree of anomaly.
Given the lower dimensional data, we can project it back, or rebuild from it, to the higher dimensional space. If the recovered reconstructed vector is too different from the new day’s original vector, we raise an alert. This is the principle behind anomaly detection using SVD. A good reference on how this works in mathematical details for a different application is in [1].
Now let’s talk about the computation. From collecting users’ historical data, to performing SVD per user, and to scoring new day’s activities, all users’ data can be computed independently. This is an embarrassingly parallel problem. A typical enterprise has tens to hundreds of thousands of users. This scale can only be done in a distributed computing environment such as HDFS and Apache Spark.
This method works well to detect sudden pattern change or volume changes in a new day’s activities. However, for subtler activity changes, other methods are required, including incorporating more contextual information. But indeed, this represents one of the low-hanging fruit use cases in UEBA.
[1] https://www.cs.cornell.edu/people/egs/cornellonly/syslunch/fall04/anomalies.pdf
Similar Posts
Recent Posts
Stay Informed
Subscribe today and we'll send our latest blog posts right to your inbox, so you can stay ahead of the cybercriminals and defend your organization.
See a world-class SIEM solution in action
Most reported breaches involved lost or stolen credentials. How can you keep pace?
Exabeam delivers SOC teams industry-leading analytics, patented anomaly detection, and Smart Timelines to help teams pinpoint the actions that lead to exploits.
Whether you need a SIEM replacement, a legacy SIEM modernization with XDR, Exabeam offers advanced, modular, and cloud-delivered TDIR.
Get a demo today!


