-
- Home
>
-
- Blog
>
-
- InfoSec Trends
Anomalous User Activity Detection in Enterprise Multi-Source Logs
- Sep 30, 2017
- Derek Lin
- 5 minutes to read
Table of Contents
Network users’ activities generate events every day. Logged events collected from multiple sources are valuable for user activity profiling and anomaly detection. A good analytics use case for insider threat detection is to see if a user’s collection of events today is anomalous to her historical daily collections of events. In an earlier blog, I highlighted a method to address this use case that leverages distributed computing built on HDFS and Apache Spark. In this blog, I’ll describe the work in more detail. This work will be published as a research paper in the Intelligence and Security Informatics workshop in the upcoming International Conference of Data Mining in November 2017.
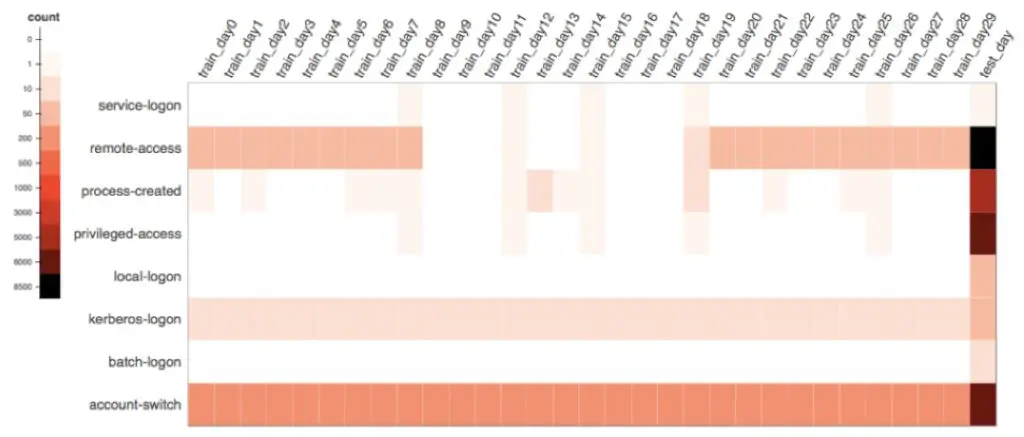
In order to explain how the algorithm works, we first need to understand how to mathematically capture a user’s daily event activity. As illustrated in Figure 1, we visualize a user’s activity data in a heat map representing a data matrix where row i is the event type index and column j is the day index. A cell in the i row and j column records how many times this user generates the event type i on the day j. We can see the user’s event type activity on the last test day has a significant change in patterns compared to her history. She performs an interactive logon (local-logon) on a machine for the first time, coupled with high volume of privilege activities such as account switching (account-switch) or obtaining privilege access (privilege-access). This is a security risk if the subsequent forensic effort determines the above actions are performed on a critical server. Example behavior change such as this is indicative of either a malicious activity or IT policy misuse, worthy of further investigation.
In the previous blog, I talked about the use of Principal Component Analysis (PCA)-based model to learn the event activity “patterns” in history. We can then compare the test day’s activity and see how well it can be explained by the model. Or phrased in a more mathematical way, we want to see how well the test day’s data can be “reconstructed” from the PCA model. To be more precise, the model captures the subspace spanned by a set of eigenvectors that approximate 95% of eigen mass in the original space. In any case, the reconstruction error measures the degree of anomaly.
Such a PCA-based method for general anomaly detection is not new. However, to enable it for practical application, there is more than meets the eye. Its implementation needs to be critically supported by two steps. First, a meta data extraction step made possible by valuable security knowledge. Second, a data calibration step for optimal signal enhancement. Let me explain the two data preprocessing steps.
Meta data extraction
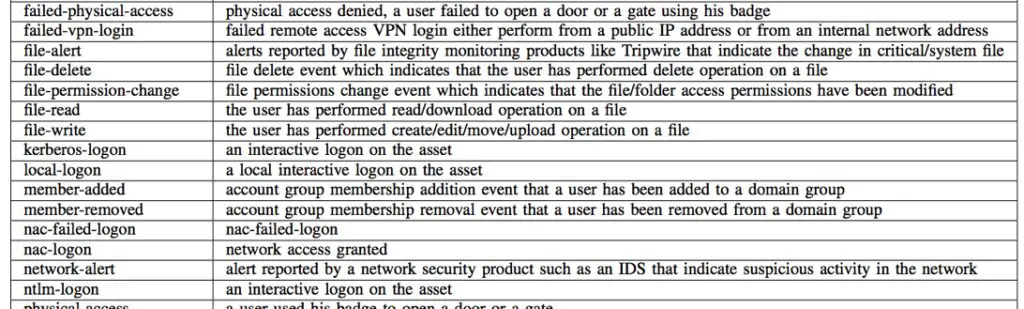
Raw events from users’ activities are logged by a myriad of security products; examples are Active Directory services, Identity management products, web proxy, data loss prevention products, data security products, badging system products, and cloud services. Custom parsers for these log sources and their varying versions are required to extract the raw events. Security knowledge is required to organize and categorize these raw events, some of them esoteric, to meta events for the right granularity to enable behavior learning. These meta events are partially listed in Table 1 (a fuller list is in the ISI-ICDM’17 paper). For example, the “Kerberos-logon” meta event is mapped from Windows AD event ID 4768 or 672. Or the “remote-access” meta event is for Windows event ID 4769 or 2624 with logon type 3 or 8. The mapping of raw events to meta events is non-trivially designed by subject matter experts who are familiar with the logs generated from various services and products. These meta events are indexed by rows as in Figure 1.
Data calibration
For modeling purposes, not all meta events are regarded with equal importance. Anomalies due to changes in common meta events (ex. kerberos-logon or ntlm-logon) are less interesting than those with rarer occurring meta events (ex. account-password-change or member-added). We want to reflect their relative importance in a way similar to the use of inverse document frequency for text mining. A meta event is considered less important if it is observed across many users and time slots (hour) over the training period. More precisely, for a meta event ri, its weight factor wri is
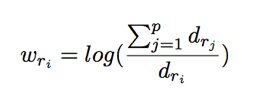
where dri is the count of unique tuples of user and active hour observed over n days of data. Observed frequency count of a user accessing the meta event ri is calibrated by or multiplied with the weight. This step guides the PCA-based learning to pay more attention to meta events that are deemed more interesting.
Reconstruction error score normalization
Once a user’s data is fully pre-processed, a PCA-based model is built over her training period. Her test day’s data is evaluated for its degree of anomaly to see how well the data can be explained by or reconstructed from the PCA model. On the test day, the reconstruction error is computed, one for each user. If we have N users, then on a test day we would have N reconstruction error scores. It might seem enough now to choose a threshold to flag users if their scores exceed the threshold. Yet, these scores are not directly comparable to one another since users’ models are independently derived and they are unrelated to one another. As an analogy, we have a situation akin to announcing who is to win the “most improved” award in a running race. Each runner’s race time should be compared against her own records in the past, rather than against other runners’ current best times. This means, we can’t simply impose a threshold over the independently derived reconstruction error scores across the user population to flag alerts. We must first normalize each user’s score with respect to her own “data space” before applying a threshold. Mathematically, we scale user n’s reconstruction error score en in proportion to the ‘size’ of its respective data space spanned by the K eigenvectors. This is done by dividing en by the total variance of the eigen space of the PCA model. That is,
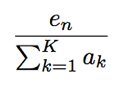
where ak is the k’th eigen value in the user’s data space spanned by K eigenvectors. After this score normalization setup, a single threshold can be used for alerting.
Result
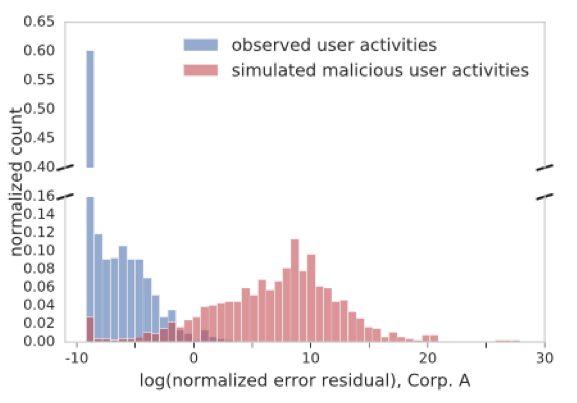
How do we evaluate? Our qualitative evaluation by Exabeam’s in-house analyst indicates the framework is capable of flagging daily user activities worthy of investigation. They have apparent anomalous characteristics, particularly in either volume or event changes. Nevertheless, a quantitative evaluation is always desired, despite that known insider threat cases are either non-existent or too few to be useful. Here, a scheme called negative sampling comes to the rescue. It is often used to evaluate unsupervised learning methods under the right settings. We first assume all observed data is normal and thus labeled as ‘legitimate’. Then we simulate ‘malicious’ or attack data against a user by replacing her test data with another randomly chosen user’s data. By doing this, we can get enough labelled activities for a quantitative evaluation. Figure 2 below shows the score distribution between the simulated attack and assumed-legitimate activity data over a testing period. We readily observe a good separation in the labelled score distribution, which means our score can differentiate the malicious from the legitimate.
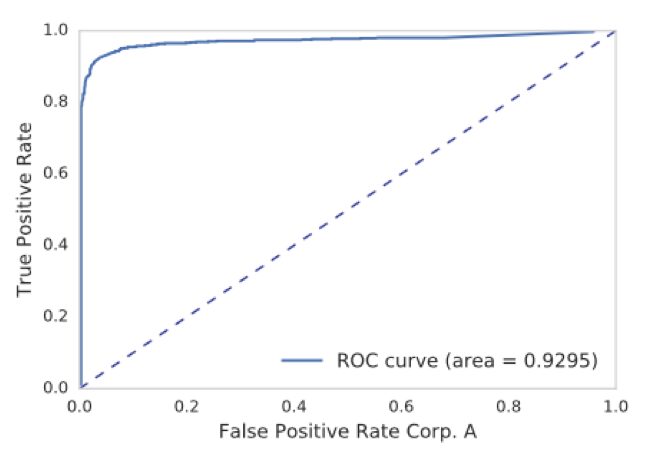
The corresponding ROC plot is shown on Figure 3. An ROC curve shows the tradeoff between the detection rate and false positive rate for a given threshold. We see a high detection is achievable with a small false positive rate close to zero.
In this blog I describe a user activity behavior anomaly detection method for practical purpose. It is a good example of how the success of a data science use case is typically more than simply selecting a learning algorithm. For our application, its implementation is supported by security knowledge to intelligently transform the data. Proper data conditioning is needed for optimal data preparation, as well as a post processing step for score normalization.
- Tags
- Data Science

Derek Lin
Chief Data Scientist | Exabeam | Derek Lin is the Chief Data Scientist at Exabeam, building products to help security teams accelerate and improve threat detection, investigation and response (TDIR) by adding intelligence to their existing security tools. His current and prior machine-learning research interests include behavior-based security analytics, risk-based banking fraud detection, and speech and language recognition. He holds numerous patents and authors papers in areas of fraud detection and cybersecurity.
More posts by Derek LinLearn More About Exabeam
Learn about the Exabeam platform and expand your knowledge of information security with our collection of white papers, podcasts, webinars, and more.
-
 Blog
Blog
Five Reasons Security Operations Teams Augment Microsoft Sentinel With New-Scale Analytics
- Show More