Log Management Explainers:
Azure Log Analytics: the Basics and a Quick Tutorial
What is Azure Log Analytics?
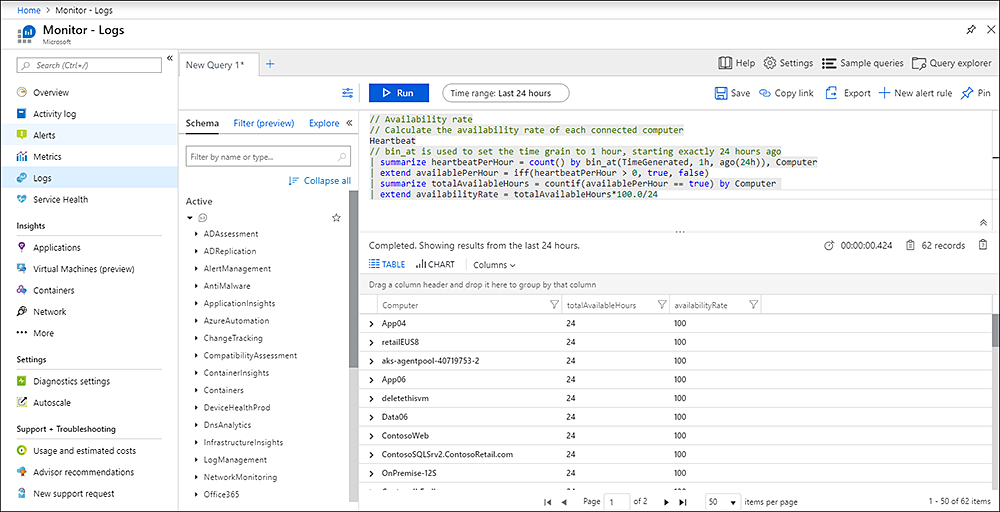
Azure Log Analytics is a service that monitors your cloud and on-premises resources and applications. It allows you to collect and analyze data generated by resources in your cloud and on-premises environments.
You can use Azure Log Analytics to search, analyze, and visualize data to identify trends, troubleshoot issues, and monitor your systems. You can also set up alerts to notify you when specific events or issues occur, so you can take action to resolve them.
This is part of a series of articles about log management.
How Azure Log Analytics works
To access Azure Log Analytics, you need to sign in to the Azure portal with your Azure account. Once you’re signed in, you can access Log Analytics by selecting it from the list of services in the portal.
To use Log Analytics, you need to create a Log Analytics workspace in your Azure subscription. A workspace is a logical container for data that is collected and analyzed by Log Analytics. You can create multiple workspaces to organize data from different sources, or to use different data retention and access policies.

Some of the main features of Azure Log Analytics include:
- Wide range of data sources: Once you have a workspace set up, you can start collecting data from your resources and applications. Log Analytics supports a wide range of data sources, including Azure resources, on-premises servers, applications, and various types of log and performance data. You can use the Log Analytics agent or other data collectors or APIs to send data to your workspace, security log repository, or SIEM.
- Powerful query language: Log Analytics provides a powerful query language that you can use to filter, group, and aggregate data.
- Predefined queries and solutions: Use pre-built queries and solutions to get started quickly, or create your own custom queries and solutions.
- Monitoring and alerting: You can use Log Analytics to set up alerts that trigger when specific events or issues occur, and you can specify actions to be taken when an alert is triggered.
- Dashboards: Create dashboards to display real-time and historical data from your resources and applications.
Quick tutorial: Exploring the Azure Log Analytics demo environment
This tutorial uses the Log Analytics demo environment, which includes sample data that you can use to explore this service’s capabilities and learn how to use it.
Open Log Analytics
To open Log Analytics using the Log Analytics demo environment, follow these steps:
- Go to the Log Analytics demo environment website.
- Click on the Sign in button in the top right corner of the page.
- Enter your email address and click Next.
- Enter your password and click Sign in.
- After signing in, you will be taken to the Log Analytics dashboard. From here, you can access all of the features of Log Analytics, including search, analysis, and visualization.
To get started with Log Analytics, you can try running some of the predefined queries and solutions, or you can create your own custom queries and solutions using the Log Analytics query language. You can also set up alerts and create dashboards to monitor your data in real-time.
Note that the Log Analytics demo environment is a simulated environment and is not connected to any real data sources. It is intended for demonstration and learning purposes only. To use Log Analytics with your own data, you will need to set up a Log Analytics workspace in your Azure subscription.

View table information
To view table information in Azure Log Analytics using the Log Analytics demo environment, follow these steps:
- Go to the Log Analytics dashboard by clicking on the Dashboard button in the top menu.
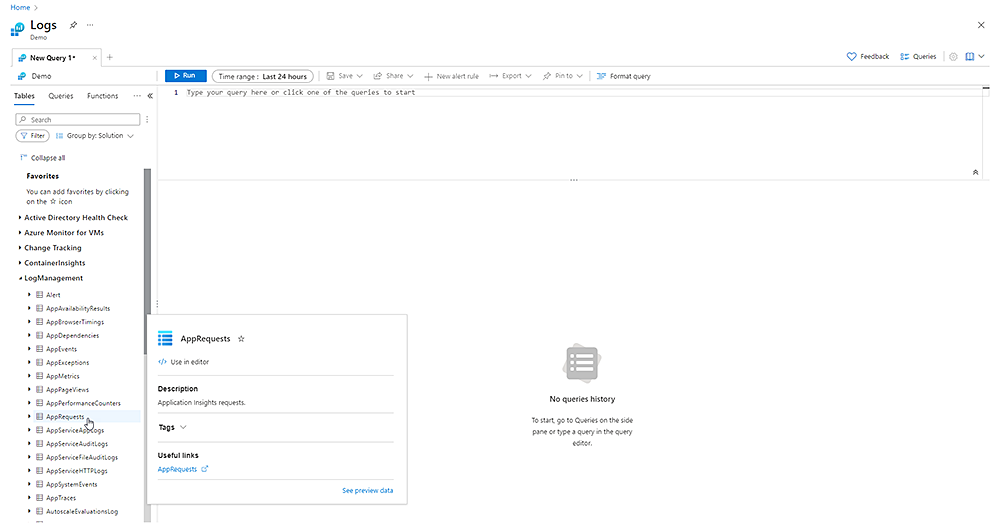
- On the dashboard page, click on the Tables tab in the left menu. This will display a list of all of the tables in the demo environment.
- To view the contents of a table, click on the name of the table in the list. This will open the table viewer, which allows you to view and analyze the data in the table.

The table viewer includes a number of features for searching, filtering, and visualizing the data. You can use the search box at the top of the table viewer to enter a query to filter the data, or you can use the column filters to narrow down the data by specific values.
You can also use the table viewer to create charts and other visualizations of the data. To do this, click on the “Visualize” button in the top menu, and then select the type of visualization you want to create. You can then use the options in the visualization editor to customize the visualization as needed.
Write a query
To write a query in Azure Log Analytics using the Log Analytics demo environment, follow these steps:
- Go to the Log Analytics dashboard by clicking on the Dashboard button in the top menu.
- On the dashboard page, click on the Logs tab in the left menu.
- In the search box at the top of the page, enter your query using the Log Analytics query language.
- Press the Enter key or click the Run button to execute the query.
The Log Analytics query language is a powerful and flexible way to search and analyze data in Log Analytics. It includes a variety of operators and functions that you can use to filter, group, and aggregate data.
Analyze results
To analyze query results, you can use the options in the table or visualization to filter, group, and aggregate the data. For example, if you ran a query that returned a table of log entries, you might want to group the results by a specific column or apply a filter to show only certain rows. To do this, you can use the column filters and the search box at the top of the table to narrow down the data.
If you ran a query that returned a visualization, you can use the options in the visualization editor to customize the visualization. For example, you might want to change the data being displayed, or apply filters to the data.
Work with charts
To work with charts in Azure Log Analytics, follow these steps:
- Go to the Log Analytics dashboard by clicking on the Dashboard button in the top menu.
- On the dashboard page, click on the Logs tab in the left menu.
- To create a chart, click on the Visualize button in the top menu and select the type of chart you want to create.
- In the visualization editor, select the data you want to use for the chart by entering a query in the search box.
- Use the options in the visualization editor to customize the chart as needed. For example, you can change the axis labels, add data labels, or change the colors of the data series.
- When you’re finished customizing the chart, click the Save button to save the chart to the dashboard.
To view a saved chart, click on the Dashboards tab in the left menu and select the dashboard that contains the chart. The chart will be displayed on the dashboard page, and you can use the options in the chart to interact with it.
Azure Log Analytics best practices
Use as few Log Analytics workspaces as possible
It is generally recommended to use as few Log Analytics workspaces as possible for a few reasons:
- Cost: Each Log Analytics workspace incurs a separate charge based on the amount of data ingested and stored in the workspace. By using fewer workspaces, you can potentially reduce your costs.
- Simplicity: Using fewer workspaces can make it easier to manage your data and queries. Instead of having to switch between multiple workspaces, you can keep all of your data and queries in a single workspace.
- Data retention: Each workspace has its own data retention policy, which determines how long data is kept in the workspace. By using fewer workspaces, you can potentially simplify your data retention policies.
- Data access: Each workspace has its own set of users and access controls. By using fewer workspaces, you can potentially simplify your access controls and make it easier to manage user access to your data.
However, there may be cases where it makes sense to use multiple workspaces. For example, if you have different teams working on separate projects, or if you have different data retention and access requirements for different sets of data, you might want to use separate workspaces to keep the data separate.
Use role-based access controls (RBAC)
RBAC allows you to control access to your Log Analytics workspace and the resources it uses based on the roles that you assign to users and groups. By using RBAC, you can ensure that users have the permissions they need to do their jobs, while also protecting your data and resources from unauthorized access.
There are several built-in roles in Azure that you can use to grant access to Log Analytics, including the Log Analytics Reader role and the Log Analytics Contributor role. You can also create custom roles with specific permissions to meet your specific needs.
It’s a good idea to carefully consider which roles to assign to users, and to review and update the roles as needed to ensure that they are appropriate for the user’s responsibilities.
Consider ‘table level’ retention
By default, Log Analytics has a global data retention policy that applies to all data in the workspace. However, you can also set specific retention policies for individual tables in the workspace. This is known as “table level” retention.
Table level retention can be useful in a few cases:
- Different data retention requirements: Different types of data may have different retention requirements. By setting specific retention policies for different tables, you can ensure that data is kept for as long as it is needed, while also reducing the overall amount of data that is stored in the workspace.
- Data compliance: In some cases, you may be required to keep data for a specific period of time to meet compliance requirements. By setting table level retention policies, you can ensure that you meet these requirements without keeping unnecessary data in the workspace.
- Cost savings: Storing data in Log Analytics incurs a cost based on the amount of data ingested and stored. By setting specific retention policies for different tables, you can potentially reduce your costs by keeping only the data that is needed.
Use ARM Templates to Automatically Deploy VMs
Azure Resources Management (ARM) templates are JSON files that define the infrastructure and resources for your Azure solutions. They allow you to automate the deployment and management of your resources, including virtual machines (VMs).
Using ARM templates to deploy your VMs has several benefits when using Log Analytics:
- Consistency: ARM templates allow you to define the exact configuration of your VMs, including the operating system, hardware, and software. This can help to ensure that your VMs are deployed consistently across your environment.
- Version control: ARM templates are stored in source control, which allows you to track changes to your templates and roll back to previous versions if needed. This can be useful for managing the configuration of your VMs over time.
- Automation: ARM templates can be used in continuous integration and continuous deployment (CI/CD) pipelines as part of your software development lifecycle, which allows you to automate the deployment and management of your VMs.
- Reusability: ARM templates can be reused to deploy similar VMs in other environments or subscriptions, which can save time and reduce the risk of errors.
Security log management with Exabeam
Managing cloud security can be a challenge, particularly as your data, resources and services grow. Misconfiguration and lack of visibility are frequently exploited in data and system breaches. Both issues are more likely to occur without centralized tools.
Azure Log Analytics dashboards and services may be enough to provide basic visibility for specific development or DevOps teams. However, most organizations need more advanced security measures and have specific teams and groups that monitor security as a whole rather than specific tools or even IaaS/Paas like Azure. Logging onto multiple interfaces is not the most effective or efficient path to get a holistic view of events in your environment.
Log Analytics solutions are therefore combined with SIEMs and user and entity behavior analysis (UEBA) tools. UEBA tools create baselines of “normal” activity and can identify and alert to activity that deviates from the baseline.
Security Log Management via a SIEM or UEBA (or both in one, as in Exabeam Fusion) benefits cloud management by:
- Providing centralized monitoring – dispersed systems can be a challenge to monitor as you may have individual dashboards and portals for each service. Log Analytics can alert you to suspicious or policy-breaking behavior that you might otherwise miss in standalone dashboards.
- Creating visibility in multi and hybrid cloud systems – cloud-specific services may not be extendable to on-premises resources and vice versa. Log Analytics can help you ensure that policies and configurations are consistent across environments. For example, by monitoring data use and transfer in hybrid storage services.
- Helping you evaluate and prove compliance standards – Log Analytics can provide trackable, unified logging with evidence of actions taken. You can use Log Analytics logging and event tracking in compliance audits and certifications.
- Scaling to match your system needs – Log Analytics often use daemons or agents to monitor distributed systems. These agents allow you to scale your Log Analytics to match your environment size. You can take advantage of the scalability of any tools you use by accepting and incorporating data streams for tools across your system.
- Combining signals from Azure Log Analytics with other cloud security tools and logs such as cloud access security brokers (CASB), data loss prevention (DLP), Azure Active Directory Federation Services (AD FS) in a single platform like Exabeam can help build a full timeline of events, and gather in other associated alerts or actions that could indicate lateral movement from cloud to remote to on premise systems.


