Log Management Explainers:
Splunk Log Analysis with Log Observer: 5 Key Capabilities
What Is Splunk Log Analysis?
Splunk is a software platform that is used for searching, analyzing, and visualizing machine-generated data, such as log files, application data, and network data. It is commonly used by IT professionals to monitor and troubleshoot problems in their systems, as well as to gain insights into the performance and usage of their applications and infrastructure. Splunk can be used to search, filter, and analyze data from a variety of sources, including logs, metrics, and events, and to create real-time visualizations and reports.
Splunk log analysis is the process of using the Splunk platform to search, filter, and analyze log data to gain insights and troubleshoot problems. This involves importing log data into Splunk, creating searches and filters to extract relevant information, and using Splunk’s visualization and reporting tools to gain insights into the data. Splunk log analysis can be used to identify patterns, trends, and anomalies in log data, and to monitor the performance and health of systems and applications. It can also be used to detect security threats and compliance issues, and to help IT professionals troubleshoot and resolve problems more quickly and effectively.
This is part of a series of articles about log management.
What Is the Splunk Observability Cloud?
The Splunk Observability Cloud is a cloud-based platform that provides tools and services for monitoring, analyzing, and troubleshooting the performance of cloud-native applications and infrastructure. It is designed to help organizations understand and optimize the performance, reliability, and security of their applications and systems.
The Splunk Observability Cloud allows organizations to:
- Monitor and visualize performance of applications and infrastructure in real-time
- Analyze logs, metrics, and tracing data to identify trends and patterns
- Troubleshoot issues and optimize performance by correlating data across different sources
- Automate incident response and remediation with machine learning-powered anomaly detection and alerting
- Comply with regulatory requirements and best practices for cloud security and privacy
Splunk Log Observer: 5 Key Capabilities
Splunk Log Observer is part of Splunk Observability Cloud. It is designed to help you monitor and analyze log data from a wide variety of sources, including applications, servers, and networking devices.
With Splunk Log Observer, you can collect, index, and search log data in real time, and use powerful analysis and visualization tools to identify patterns, trends, and anomalies. You can also use it to create custom dashboards and alerts to help you monitor the health and performance of your systems.
Splunk Log Observer provides a range of features and tools to help you extract insights from your log data, including machine learning-based analytics, data enrichment, and custom search queries. It also integrates with a wide range of third-party tools and services, such as cloud platforms, application performance management (APM) tools, and incident response platforms.
1. Splunk Log Observer Connect
The Splunk Log Observer Connect integration lets you query logs from the Splunk Cloud Platform or Splunk Enterprise using Splunk Log Observer. It also allows you to review content from Splunk Observability Cloud. For example, you might use parent-context logs to troubleshoot the behavior of infrastructure and applications.
Another possibility is to execute codeless queries against Splunk logs to identify the root cause of system issues. Then you can directly view the content in Observability Cloud. Teams can view metrics, traces, and related log data to investigate and resolve problems quickly.
2. View Overall System Health Using Timeline
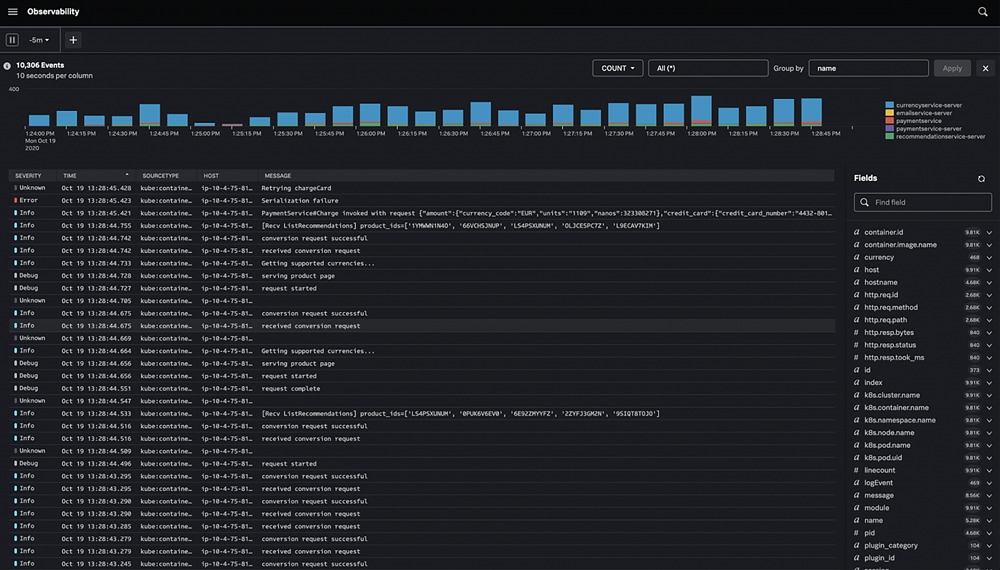
The timeline feature in Splunk Log Observer allows you to view and analyze log data over a specific time period. You can use the timeline to identify patterns, trends, and anomalies in your log data, and to see how your systems have been performing over time.
To use the timeline feature in Splunk Log Observer, you can select a time range for the data you want to view, and then use the various visualization and analysis tools to explore the data. For example, you can use the timeline to view trends in log data over time, such as the number of errors or the volume of traffic to your systems. You can also use the timeline to view specific events or patterns that occurred during a particular time period.
The following screenshot shows a count of events grouped by the event field called name:

3. Log Metricization
Log-derived metrics are metrics that are calculated from log data. They can be used to measure a wide variety of performance and operational metrics, such as the number of errors, the volume of traffic, or the response time of a system.
To create log-derived metrics in Splunk Log Observer, you can use the search and analysis tools to define and calculate the metrics you want to track. For example, you can use the search language in Splunk Log Observer to define a metric that counts the number of error messages in your log data over a specific time period. You can then use this metric to track the performance of your systems and identify trends or patterns in the data.
4. Log Aggregation to Group Logs into Fields
You can aggregate logs to group related log data into fields and perform calculations. Aggregated logs can generate statistics such as totals and averages across related logs, helping to visualize problems.
For instance, you might view a log table to evaluate the performance of different services, focussing on each service’s response time. By grouping log records based on service URLs and aggregating log data, you can calculate the average response time and identify slower services. You can then investigate the logs of slower services you’ve identified to understand why they respond slowly.
5. Logging Rules
There are several rules you can use in Splunk Log Observer:
- Search time rules: These are log processing rules that you apply to historical data. Log processing rules may occur at search or index time. Index time rules only apply to data streams after you create the rules. Search time rules can apply to issues discovered in retrospect.
- Log processing rules: These can add value by transforming the raw data logs when new data arrives.
- Unlimited record rules: These allow you to archive some or all logs in an Amazon S3 bucket for future use or compliance purposes. You don’t have to pay for log indexing if you don’t use Log Observer to analyze the logs.
Adding Splunk Log Analysis to Exabeam
Splunk log analysis data can be very useful to add to context or additional sources to the Exabeam Smart TimelinesTM. While Splunk collects and analyzes logs from multiple business and data sources, these may not have security tools specifically monitoring them. Adding specific security events via parsed log data in a Common Information Model from Splunk Log Analysis and Log Observer can help a security analyst quickly see where events there are related to events of interest to security operations.
From malicious actors deleting logs or otherwise obscuring their paths to a sudden breakdown of communication, these are indications of potential compromise that, combined with Exabeam behavior analytics, can quickly identify potential issues that go unseen or unremarked by simple log observance and health analytics.
Ingesting Splunk logs into Exabeam Advanced Analytics can be a cost savings as well – logs are parsed, context is added, and events built and analyzed for quick responses that don’t require long-term event storage double ups. Exabeam Smart Timelines models behavior and assigns risk scores for specific users or devices whose observed event patterns sufficiently differ from their past patterns — and help the security team see problems fast without needing advanced query skills.
Learn more about Exabeam Security Investigator or Exabeam Fusion


