


Preparing for the Log Data Tsunami? Security Best Practices for the Exabeam Data Lake

Many modern enterprises—like consumer banking, airlines, cruise ship, and retail industries—produce massive amounts of logs on a daily basis. Security operations centers (SOC) need to ingest and analyze these logs to detect anomalies and identify security threats. A July 2018 report by Shape Security notes that airlines, consumer banks, and online retailers are seeing a 60 percent increase in criminal login attempts with hackers looking to steal valuable items like cash, airline points, and merchandise. These hackers use programs that apply stolen data in a flood of login attempts, called “credential stuffing.”
Given this threat landscape, it’s important for businesses to ingest all their security logs in near real-time, process it, and make it available for intelligent cyber threat analysis. Handling such massive data volumes requires a security data lake that can scale with sophisticated management of data.
Exabeam’s Data Lake is designed for exponential log data growth and the complexity of cybersecurity analysis. With Data Lake you can collect and store unlimited amounts of security data for robust threat detection and compliance use cases. Security products (firewalls, VPN, DLP, proxies, etc.), network devices, endpoints, and servers all create their own logs. Without a data lake, security analysts must access the overwhelming growing number of logs from numerous sources to perform their investigations—which is an impossible task.
10 Security Best Practices for Exabeam’s Data Lake
Once you have completed setting up your Data Lake and data from various sources starts flowing in, you may think you are ready to onboard your analysts. However, without proper planning and guidance, often security analysts struggle to get the most out of their new system.
Here are 10 best practices to help you navigate Exabeam’s Data Lake and adopt it into your analysts’ workflow more effectively:
1. Use Field Explorer to find relevant logs quickly.
Data Lake’s Field Explorer provides a quick and easy way for your security analysts to navigate through log events by inspecting all field names in a given time period. Log event types, such as Windows Authentication, Network, and Firewall, are listed on the left-hand side of its search UI to facilitate discovery.
The point-and-click log data map saves time by letting even junior analysts quickly get to relevant log events—without having to develop Apache Lucene queries. Fields such as account, user, host, src_ip, and dest_ip are common starting points for any investigation.
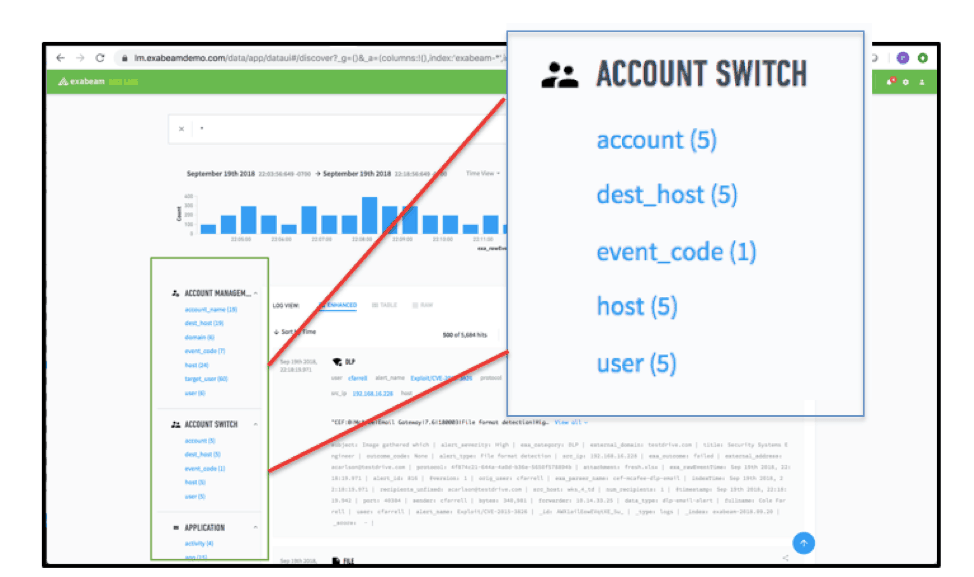
Figure 1 -Data Lake Field Explorer showing the lists of fields in log data.
2. When more is less – Narrow the time range used to search for log events in your searches, dashboards, and reports.
The Time Picker (Figure 2) lets analysts select the period in which to search data. There may be cases where you need to search for data over durations such as the Last 30 days or Last 60 days. But in many cases, you should find what you need by narrowing a search to the Last 7 days or less.
Narrow time periods return faster results and encourage follow-on searches. Those falling within the initial search period, or the most recent time period, tend to be faster due to Data Lake’s caching. In addition, you’re able to drill down into results without dealing with dreaded search spinners.
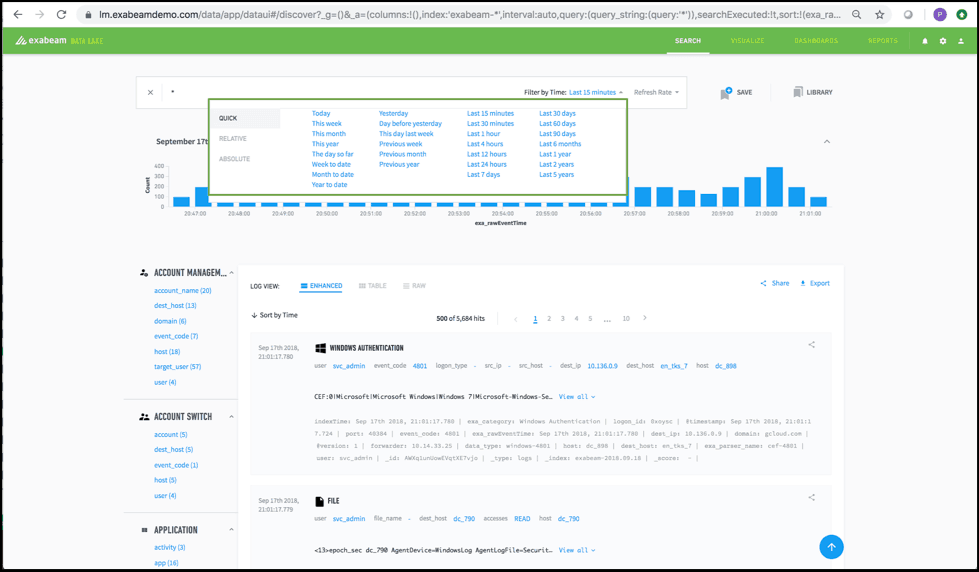
Figure 2 – Data Lake Time Picker showing the various time periods for querying log data
3. Beware of * searches.
Often it’s tempting to using a * (everything) search when you’re not sure what to look for, which time period to search in, or are simply struggling with Lucene syntax. Such a search can serve as a useful entry point to inspect your data in broad strokes and drill down further; doing it often and across time periods is inadvisable.
For systems with a large data volume, conducting searches will return a huge number of hits. If you experience a higher skew of “noisy logs,” such as from DNS queries and certain network devices, you may have to conduct multiple searches to exclude such irrelevant log events. This slows your ability to quickly get relevant results, while reducing security team productivity.
4. “Rinse and Repeat” — Save your searches—they’re free.
SOC team members often repeat the same searches. So, if you regularly perform a search to investigate specific kinds of threats or repeatable use cases, save your searches, and give them a meaningful name and description. Over time your team will have a robust collection of saved searches.
When a new team member joins and isn’t sure what to look for or how to construct a particular kind of query, they can easily look one up in the Saved Search Library to get started. Power users can seed your system with advanced queries using regular expressions and wildcards; this provides ready access for other team members who don’t have to spend time taking “regular expression” tutorials.
5. Use Table view to pin your key fields.
The real value of the Exabeam Data Lake is actualized when you send all your logs to your Data Lake, enabling you to connect all the dots during a security investigation. However, this also presents an interesting challenge.
As your system matures and you start ingesting a wide variety of logs, the number of fields grows rapidly. (Some Exabeam customers have hundreds of fields collected over time, especially those who have adopted JSON across their infrastructure.) You’ll need a way to navigate through such increased intra-log event density.
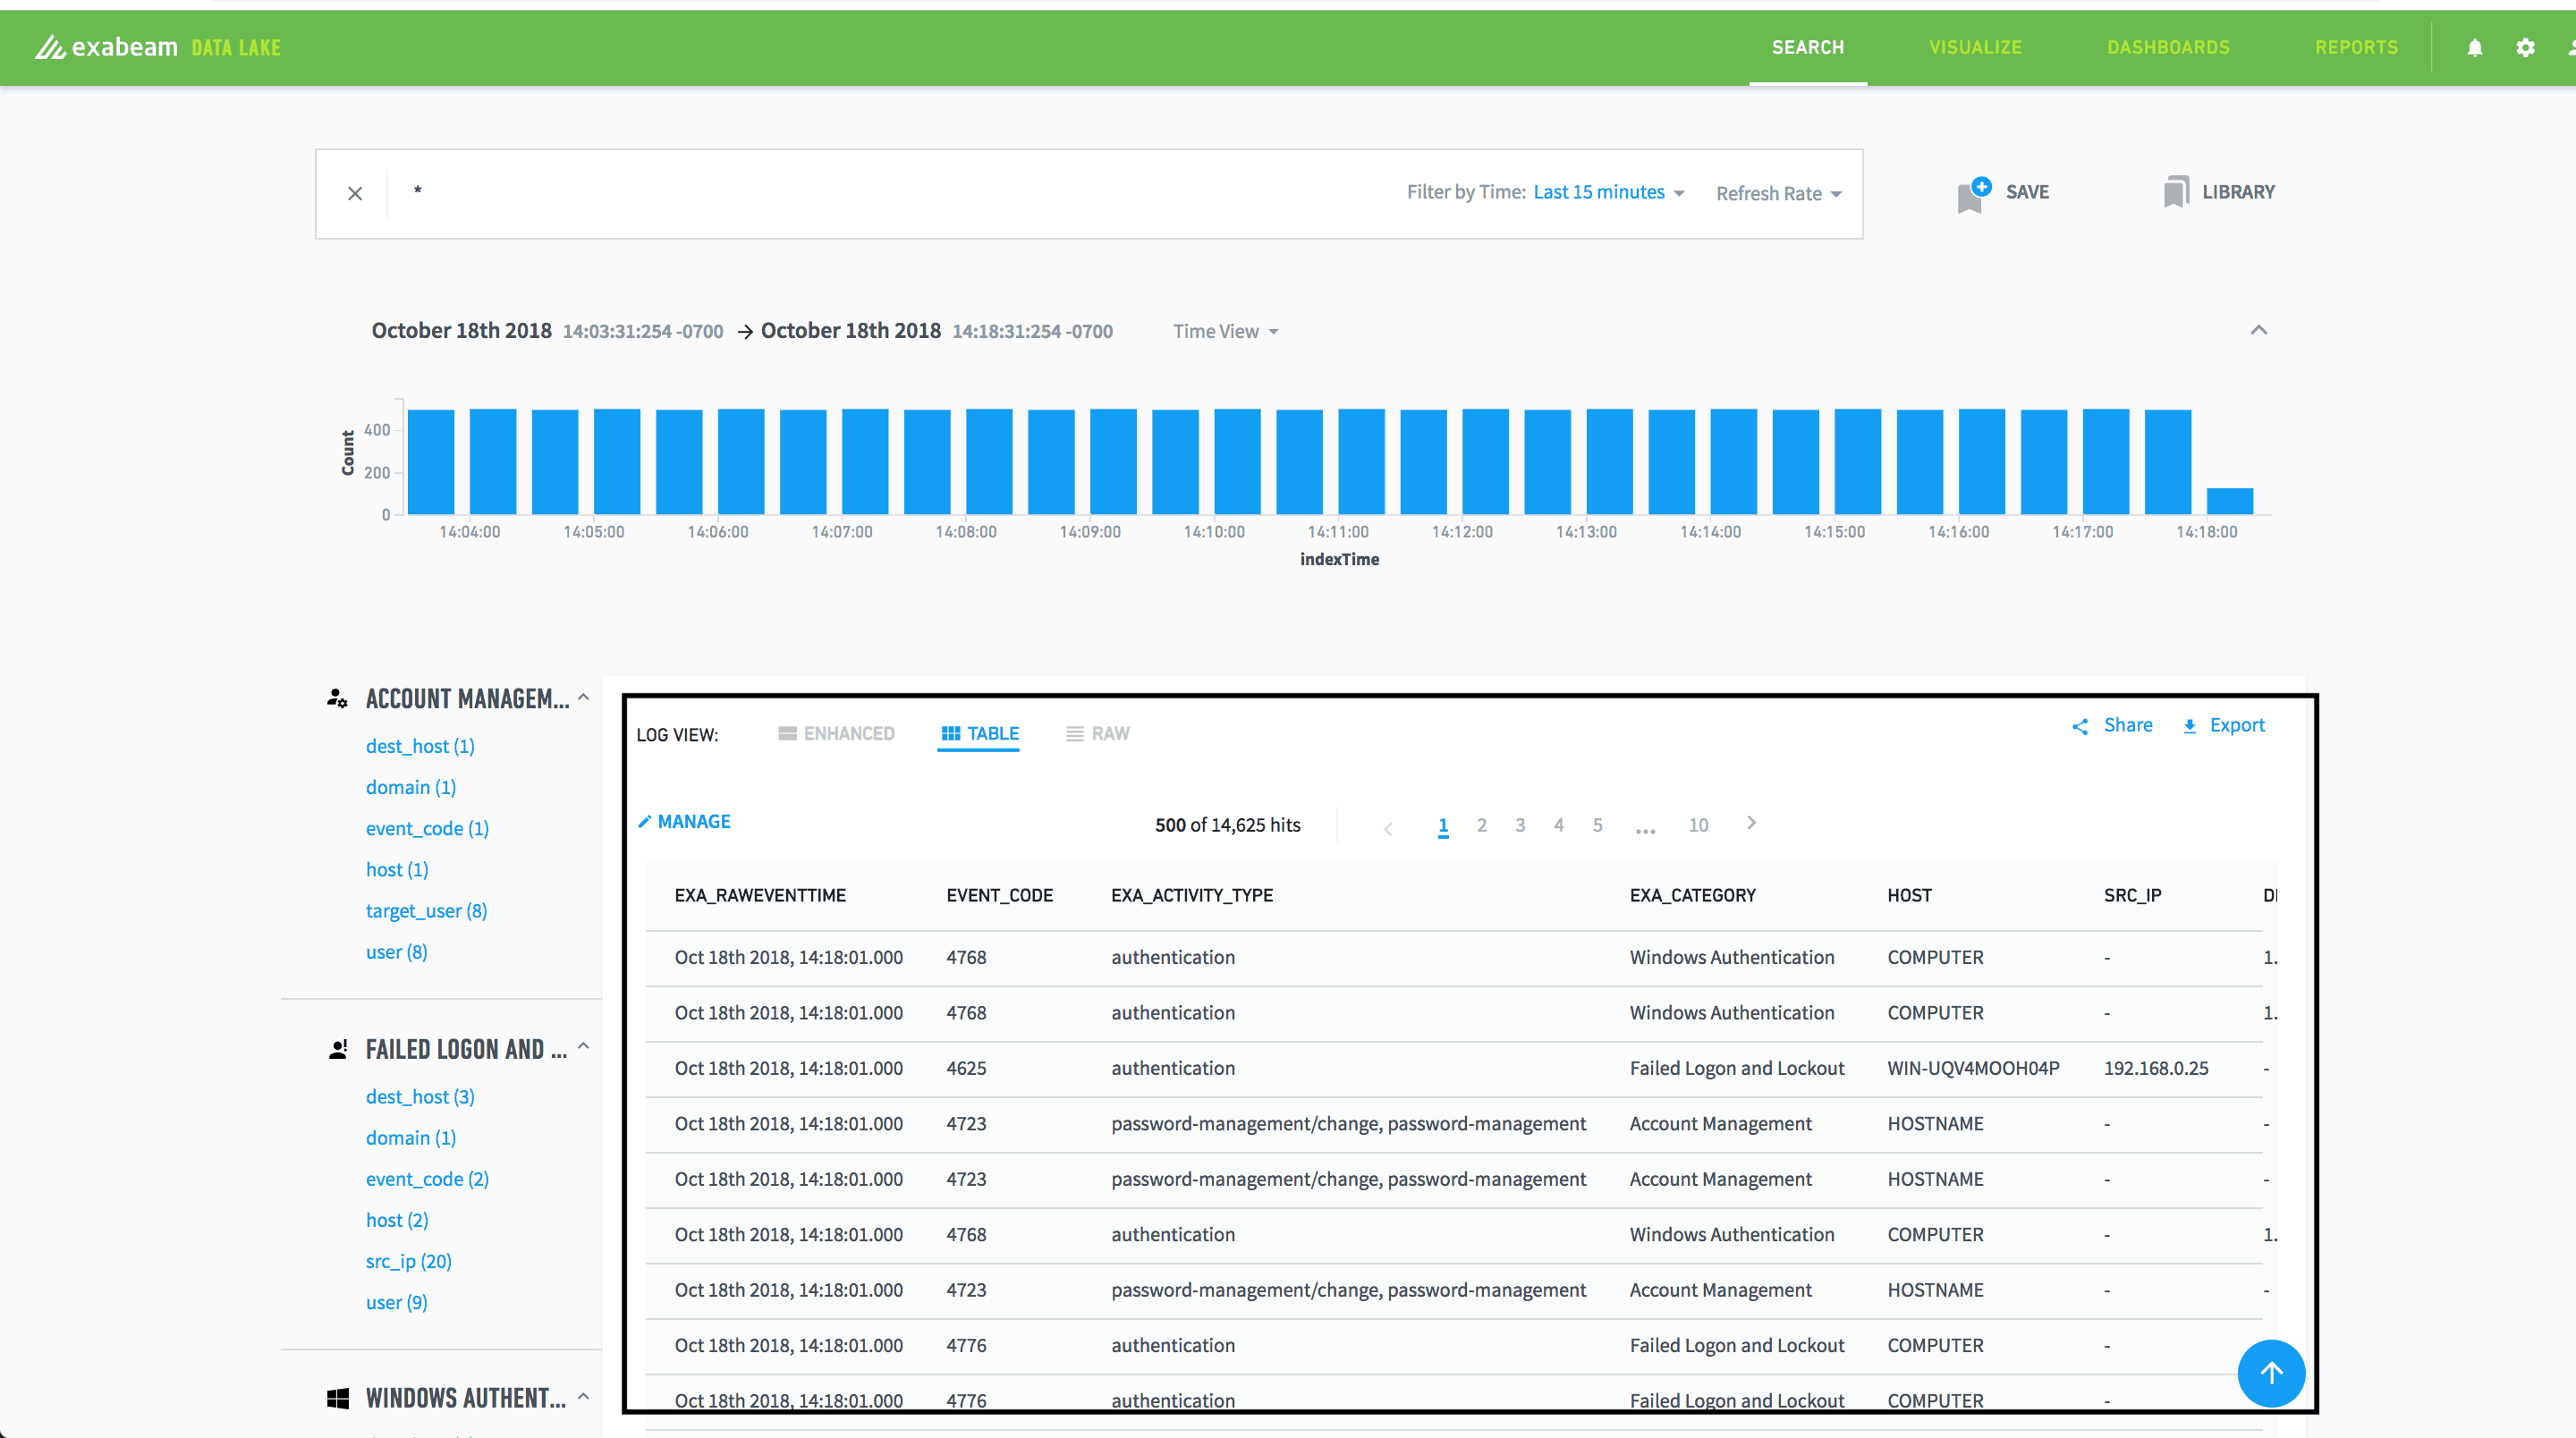
Figure 3 – Table view for search results showing important selected fields
If a given log event requires further scrutiny, highly productive users rely on specific fields to quickly make that determination. The Table view in the Search UI lets you pin key fields in a tabular format, such that you can quickly glance through them, then decide if one requires further investigation.
For example, perhaps you want to monitor logins for a given asset from a locale outside the US. You can place just that region field, along with a few others, in a Table view—instead of having to comb through a hundred or more fields.
6. Avoid email fatigue: Determine what you really need—dashboards or reports.
Out of the box, Exabeam Data Lake lets you quickly get started with powerful dashboards and reports related to NIST, PCI, and HIPAA and other compliance requirements.
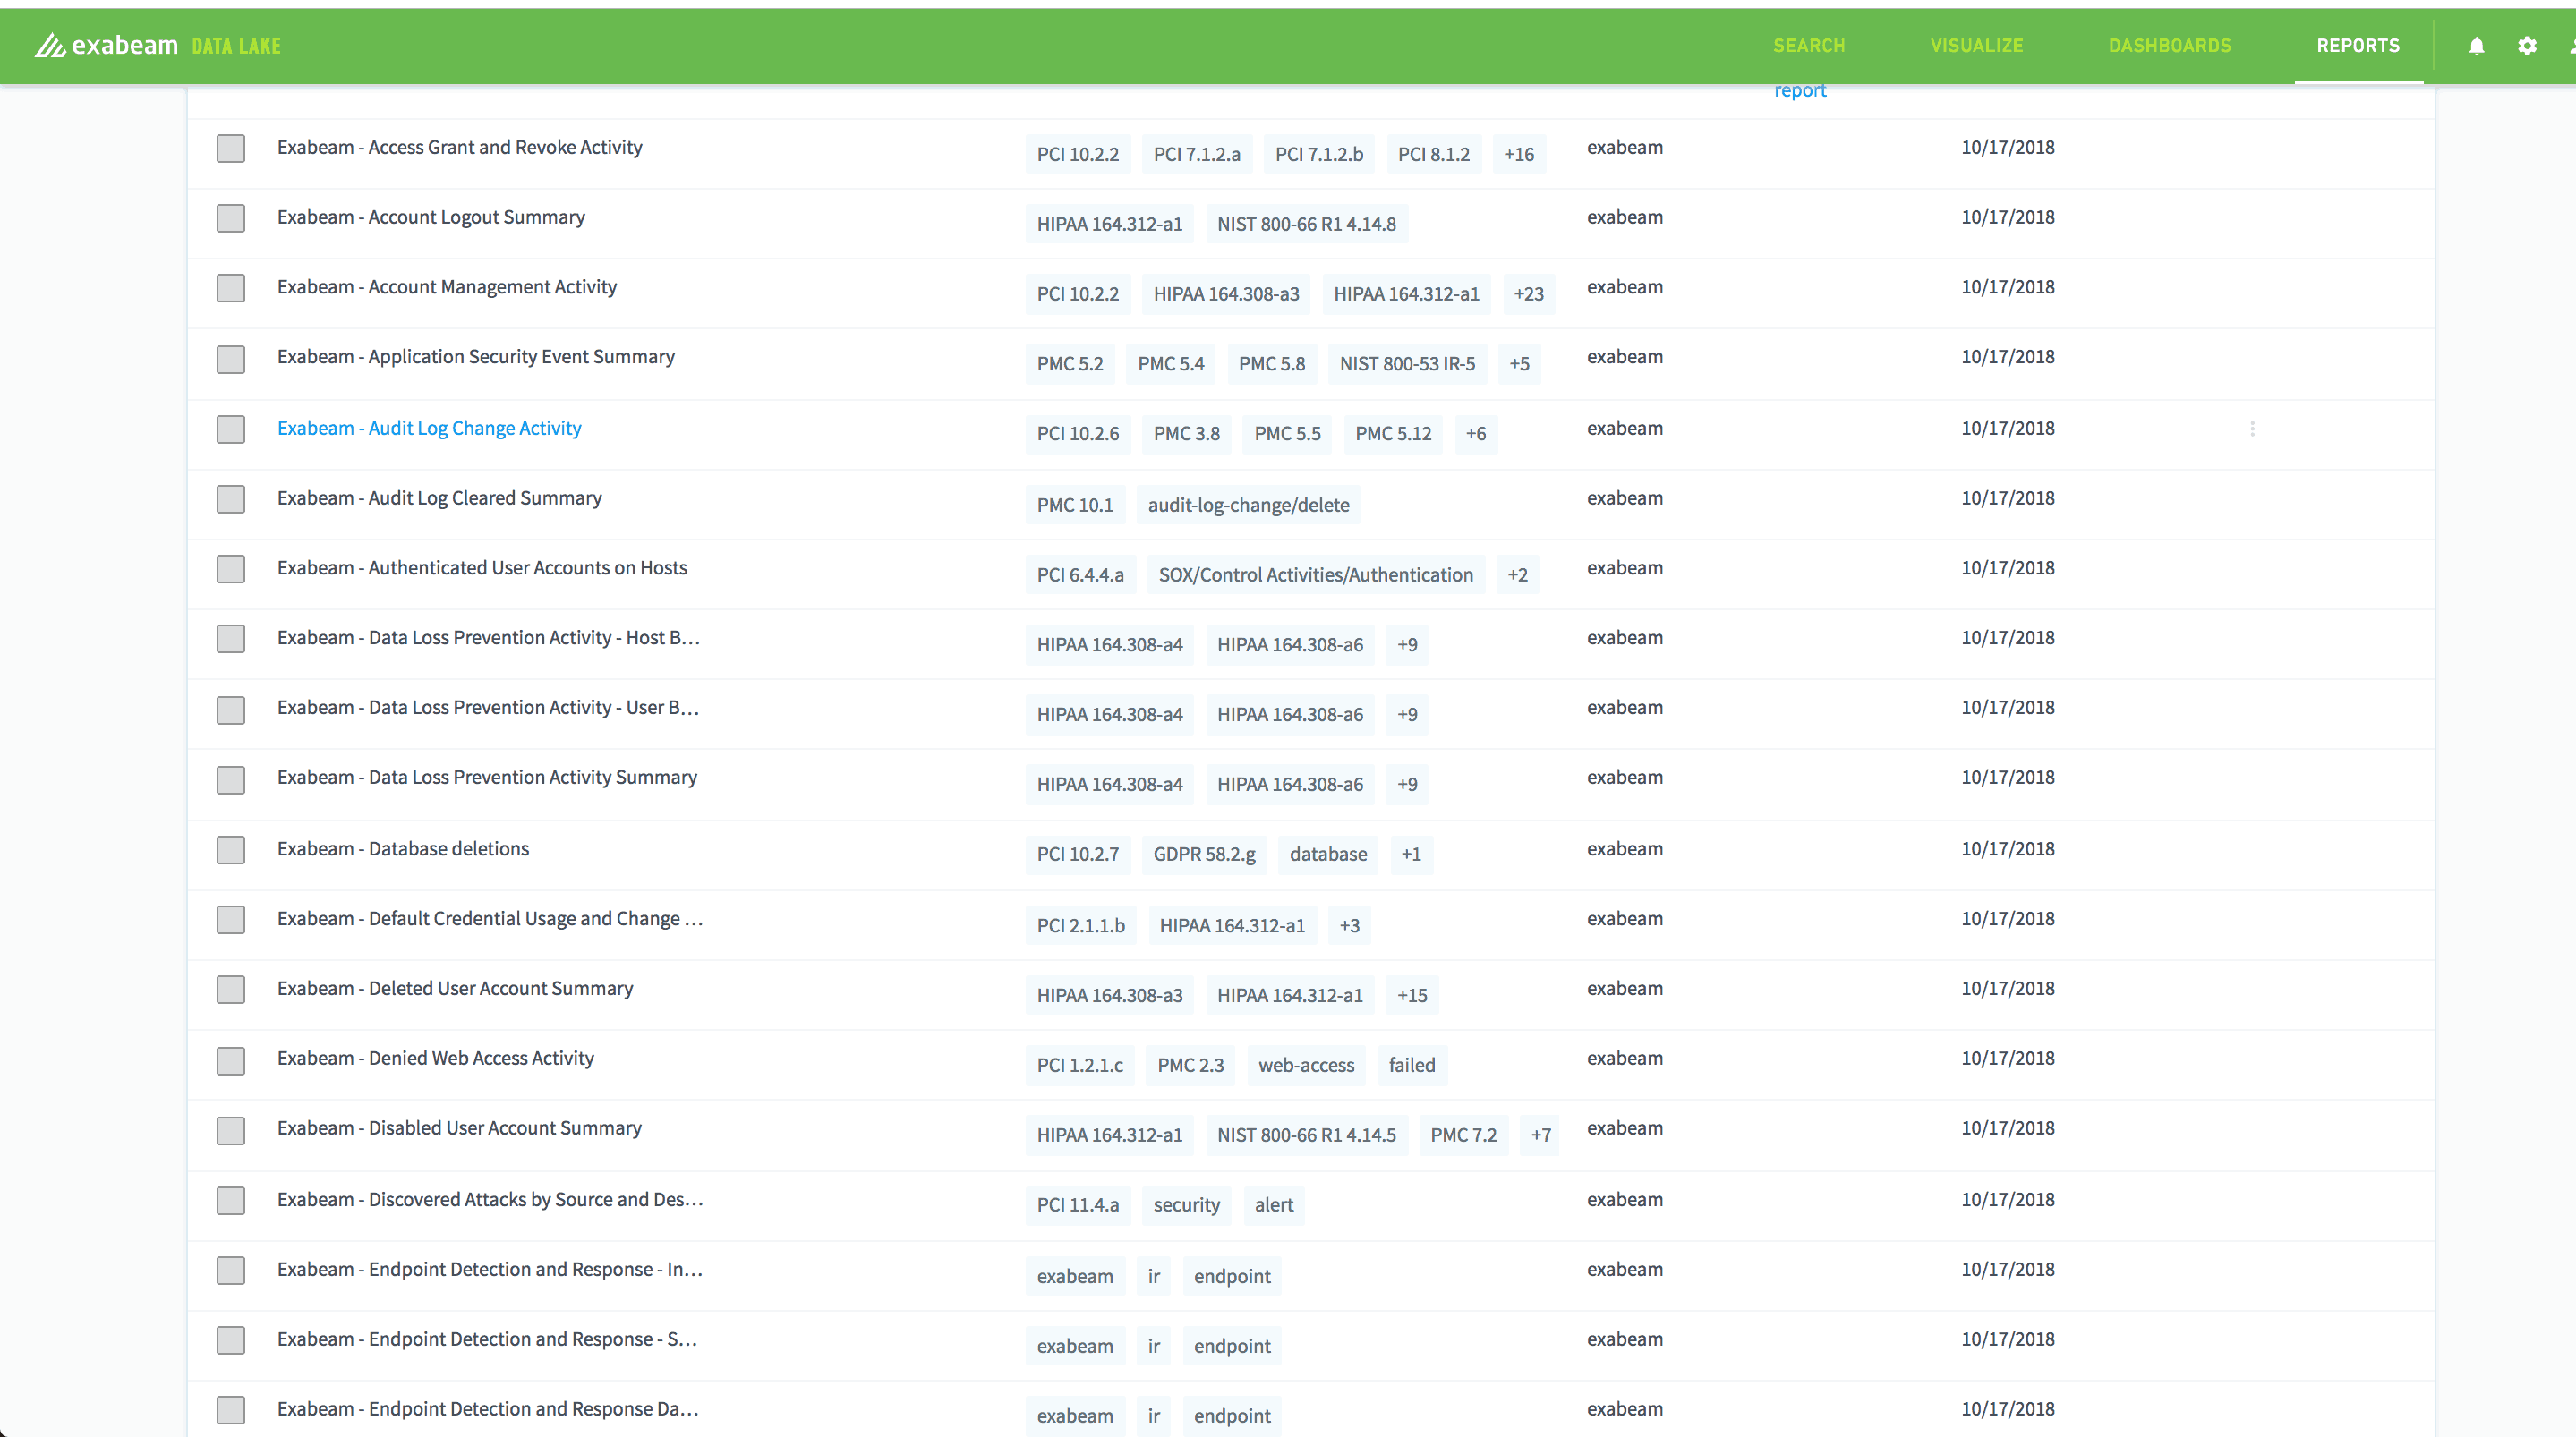
Figure 4 – Various compliance reports such as Audit Log Change Activity
You can also create your own, after first evaluating whether your use case aligns more with a dashboard or a report. Some teams distinguish between the two as active and passive monitoring channels, respectively.
Dashboards are primarily used for monitoring and are often shown on displays located in common areas. By contrast, reports let you get regularly notified or share information with others within your organization.
We don’t advise setting up every dashboard as a report. Doing so causes your analysts to experience report fatigue—especially if the report schedule is aggressive. You may also lose track of who has access to all such reporting.
7. Tune your correlation rules.
Many security teams rely on correlation rules to notify them of suspicious or outlier behavior. Data Lake lets you set up blacklist, whitelist, frequency, and a variety of other correlation rules to meet your security use cases. It’s important to regularly monitor and tune your rules so log events are accurately flagged and to minimize false positives.
Data Lake correlation rules consist of search criteria, a condition to be tested, and a time period. You can use any of these for rule tuning. Most importantly, use good judgment in determining which rules should immediately notify key stakeholders via email, and who comprises this group. Otherwise, expect complaints regarding too many email notifications.
8. Build your story first. Then visualize it.
Exabeam Data Lake provides a variety of visualizations that let you quickly spot trends and outliers. Too often, cognitive bias leads to users selecting their favorite visualization to analyze data. For effective analysis, it’s important to first have a clear sense of those questions you want a visualization to answer. Only then can you decide which one to use.
For example, if you’re interested in trends over time, a line chart works well. But if you also want to visually grasp volume ratio over time, then an area chart would serve you better. Check out the research on the pros and cons of pie charts.
9. Limit the number of visualizations on a dashboard.
Although the number of screens in one’s office may be limited, don’t make the mistake of having dashboards displaying 20 – 30 data visualizations spanning months. Too many visualizations on a single dashboard only serve to confuse your team and slow your monitoring ability.
A dashboard is meant to convey a story or highlight a relevant theme, and you’ll want it to refresh fairly quickly. Each visualization should support a specific investigation type. You also want them adjacent to one another to quickly spot correlations. If desired, you can use Google Chrome Tab Revolver to rotate several dashboards on a single screen.
10. Limit the number of data series in a visualization.
Unless you want to spot an outlier within a large number of items, you’ll benefit by limiting the number of data series in a single visualization to ten or fewer.
If you’d like to share feedback with the Exabeam Data Lake product management team, reach out through your technical account manager or leave a message on Exabeam Community
Pranay Kamat is the Group Product Manager of Data Lake at Exabeam. He has an MBA from The University of Texas at Austin and Masters degree in Computer Science from Cornell University.
Similar Posts

What’s New in Exabeam Product Development – March 2024

Take TDIR to a Whole New Level: Achieving Security Operations Excellence

Action, Remediation, and Lessons Learned: Implementing Incident Response
Recent Posts
What’s New in Exabeam Product Development – March 2024
Take TDIR to a Whole New Level: Achieving Security Operations Excellence

Generative AI is Reshaping Cybersecurity. Is Your Organization Prepared?
Stay Informed
Subscribe today and we'll send our latest blog posts right to your inbox, so you can stay ahead of the cybercriminals and defend your organization.
See a world-class SIEM solution in action
Most reported breaches involved lost or stolen credentials. How can you keep pace?
Exabeam delivers SOC teams industry-leading analytics, patented anomaly detection, and Smart Timelines to help teams pinpoint the actions that lead to exploits.
Whether you need a SIEM replacement, a legacy SIEM modernization with XDR, Exabeam offers advanced, modular, and cloud-delivered TDIR.
Get a demo today!