目次
相撲ロジックとは?
Sumo Logicは、企業がアプリケーションとインフラストラクチャを監視、管理、保護するためのインテリジェンスを提供するクラウドネイティブなプラットフォームです。ログ、メトリクス、イベントなど、さまざまなソースからのデータを集約し、リアルタイムで洞察を得ることができます。
生データを実用的なインテリジェンスに変換することで、Sumo Logicは運用、セキュリティ、コンプライアンスのユースケースをサポートします。アナリティクスと機械学習を使用して、異常の検出と潜在的な問題の予測を自動化します。これにより、IT運用の効率が向上し、脅威を早期に特定することでセキュリティ体制が強化され、迅速なトラブルシューティングとインシデント対応が可能になります。
Sumo Logicプラットフォームの概要
Sumo Logicは、ログ分析、可観測性、セキュリティへの統一されたアプローチを提供するクラウドネイティブな分散プラットフォームです。開発、セキュリティ、運用チーム間のコラボレーションをサポートします。
このプラットフォームのアーキテクチャは、マルチテナント設計における拡張性を重視している。
機械学習と分析機能により、Sumo Logicは、プラットフォームがパターンを特定し、異常を調査し、実用的な洞察を迅速に提供することを可能にする機能によって、問題の検出と解決を改善することを意図している。
Sumo Logicが提供するソリューション:
- クラウドSIEM:脅威インテリジェンスを統合し、セキュリティ・インシデントの検知と対応を自動化することで、チームが脅威に対処できるようにします。
- クラウドインフラストラクチャのセキュリティ:クラウドインフラストラクチャを保護するツールを提供し、クラウドネイティブサービスの継続的な監視と保護を保証する。
- コンプライアンスと監査:ログ、監査証跡、カスタマイズ可能なレポートを提供します。組織は、自動化されたコンプライアンスチェックによって、GDPR、HIPAA、PCI DSSなどの標準に準拠していることを証明できます。
- ログ分析:多様なソースからのログを集約し、システム・アクティビティを一元的に可視化します。これにより、運用上またはセキュリティ上の問題を調査し、解決することができます。
- インフラ監視:インフラ監視をサポートし、システムパフォーマンスの追跡、異常の検出、リソースの利用を可能にします。ログとメトリクスを関連付けることで、システムの健全性に関する洞察を提供します。
- アプリケーションの観測性:アプリケーション・レベルのメトリクス、トレース、ログを統合することで、アプリケーション・パフォーマンスに関する深い洞察を提供します。この可観測性により、チームは問題を診断し、最適なユーザー・エクスペリエンスを確保できます。
これは情報セキュリティに関する一連の記事の一部である。
Editor’s note: Updated the article to cover recent market trends, updated product information to reflect features and capabilities in 2026, and added 1 new tool.
Sumo Logicの価格モデル
Sumo Logicの価格モデルは以下の4段階です。フリープラン、エッセンシャルプラン、エンタープライズプランの価格はお問い合わせください。
フリープラン
- ログ容量:1GB/日に制限
- メトリクス容量:最大3,000データポイント/分(DPM)
- トレース容量:最大1.5GB/日
- ログデータ保持:7日間
- サポート:コミュニティ・サポート
エッセンシャルズ・プラン
- ログ容量:無制限
- 測定能力:最大50,000 DPM/日
- トレース容量:最大5GB/日
- ログデータ保存期間:最大365日
- 対応:スタンダード(8×5)対応
エンタープライズ・スイート
- ログ、メトリクス、トレース容量:無制限
- ログデータ保持:ビジネス要件に基づき、顧客定義
- リアルタイムアラート:ログ用モニター1,000人、メトリクス用モニター500人
- サポート:エンタープライズグレードの24時間365日サポート(P1インシデント)
フレックス・プラン
- ログ、メトリクス、トレース容量:無制限
- ログデータの保持:顧客定義
- データ取り込み:取り込みを予算制限から切り離し、データギャップをなくす
- サポート:エンタープライズグレードの24時間365日サポート(P1インシデント)
- 柔軟な利用が可能で、実際にスキャンしたデータ量に応じた料金設定が可能。TBあたり2.05ドル大規模なユースケースのために。
フレックス価格の見積もり:
フレックスプランでは、組織のアナリティクス使用プロファイルに基づき、カスタマイズされた価格設定が可能です。オフィシャルプライシングページでは、以下の概算価格が提示されています:
- 低使用量(スキャン1TBあたり3.14ドル):アドホックなトラブルシューティング、コンプライアンス、DevOpsチームに重点を置く組織に適しています。
- 中程度の使用量(スキャン1TBあたり2.57ドル):クラウド全体のアプリケーションの信頼性とリアルタイムのインフラ監視に適しています。
- 高い利用率(スキャン1TBあたり2.05ドル):AI主導の診断、100%の可視性、DevSecOpsワークフローによる企業全体の分析に適しています。
相撲ロジックの限界
Sumo Logicはログ分析、可観測性、セキュリティに有用ですが、いくつかの制限もあります。G2プラットフォームでは、以下のような制限がユーザーから報告されている:
- Steep learning curve for queries and dashboards: Users frequently report that the query language requires time to learn, especially for those unfamiliar with its syntax or coming from other tools.
- Complex and sometimes unintuitive user interface: The interface is often described as clunky or less intuitive, with navigation and workflows requiring extra steps in some cases.
- Performance issues with large datasets: During heavy data ingestion or when running complex queries, dashboards and search functions can slow down.
- Pricing can become expensive and unpredictable: Some users note that costs can increase quickly, particularly with usage-based pricing models or high data volumes.
- Limited flexibility in dashboards and UI customization: Certain dashboard elements have fixed layouts or limited adaptability, making customization more difficult.
- Alerting delays in some cases: Alerts may not trigger as quickly as expected compared to other monitoring platforms.
- Integration gaps with some tools: While integrations exist, users report that certain services require manual setup or lack tight integration, leading to fragmented workflows.
注目すべきSumo Logicの代替品と競合品
Security-Focused SIEM and Threat Detection Tools
1.エクサビーム

エクザビームは、セキュリティ情報・イベント管理(SIEM)ソリューションのリーディング・プロバイダーであり、UEBA、SIEM、SOAR、TDIRを組み合わせ、セキュリティ・オペレーションを加速します。同社のセキュリティ・オペレーション・プラットフォームは、セキュリティ・チームが脅威を迅速に検知、調査、対応し、運用効率を高めることを可能にします。
主な特徴
- スケーラブルなログ収集と管理:オープンプラットフォームは、ログのオンボーディングを70%高速化し、高度なエンジニアリングスキルを不要にすると同時に、ハイブリッド環境全体でシームレスなログ集約を実現します。
- 行動分析:高度な分析により、正常な行動と異常な行動を比較し、内部脅威、横の動き、シグネチャベースのシステムで見落とされた高度な攻撃を検知します。Exabeamは、他のベンダーが攻撃を検知する前に90%の攻撃を検知し、対応することができると顧客から報告されています。
- 脅威対応の自動化:インシデントのタイムラインを自動化し、手作業を30%削減し、調査時間を80%短縮することで、セキュリティ運用を簡素化します。
- 状況に応じたインシデント調査:Exabeamはタイムラインの作成を自動化し、雑務に費やす時間を削減するため、脅威の検知と対応にかかる時間を50%以上短縮します。事前に構築された相関ルール、異常検知モデル、ベンダー統合により、アラートを60%削減し、誤検知を最小限に抑えます。
- SaaSおよびクラウドネイティブオプション:柔軟な導入オプションにより、クラウドファーストおよびハイブリッド環境に対応するスケーラビリティを提供し、お客様の価値実現までの時間を短縮します。SIEMをクラウドに移行できない、または移行したくない企業向けに、Exabeamは市場をリードするフル機能のセルフホスト型SIEMを提供します。
- NetMonによるネットワークの可視化:ファイアウォールやIDS/IPSを超える深い洞察力を提供し、データ盗難やボットネットの活動などの脅威を検出すると同時に、柔軟な検索により調査を容易にします。また、Deep Packet Analytics (DPA)は、NetMon Deep Packet Inspection (DPI)エンジンを基盤としており、重要な侵害指標(IOC)を解釈します。
エクサビームの顧客は、AIを活用したリアルタイムの可視化、自動化、生産性向上ツールによって、セキュリティ人材のレベルアップを図り、コスト削減と業界トップクラスのサポートを維持しながら、負担の大きいアナリストを積極的な防御者に変えていることを常に強調しています。
2.スプランク

Splunk is a data platform to collect, analyze, and act on machine data from multiple sources. It supports security and observability use cases by providing visibility across systems, applications, and infrastructure. The platform can operate at scale across hybrid environments, enabling teams to investigate incidents, monitor performance, and manage data pipelines.
Splunk の主な機能:
- AI-native data platform: Enables ingestion, search, and analysis of machine data from various sources, supporting real-time insights and large-scale data processing.
- Unified security operations: Combines threat detection, investigation, and response with visibility, automation, and threat intelligence in one platform.
- End-to-end observability: Provides monitoring and troubleshooting across infrastructure, applications, and networks, including complex and distributed environments.
- AI and machine learning capabilities: Supports natural language interaction, workflow automation, and advanced analytics to identify patterns and anomalies.
- Extensive integration ecosystem: Supports thousands of integrations and data sources, including logs, metrics, traces, and events using open standards like Opentelemetry.

詳しくはSumo LogicとSplunkの比較ガイドをご覧ください。
5.グレイログ

Graylog is a platform focused on log management, security analytics, and incident response. It provides centralized visibility into logs and events, helping teams detect threats and investigate issues across environments. The platform supports flexible deployment options and emphasizes efficient data handling, cost control, and simplified security operations.
グレイログの主な特徴
- Centralized log management and analysis: Collects, processes, and analyzes logs from multiple sources, enabling visibility across systems and applications.
- Automated threat detection and response: Supports detection of high-risk threats and automates investigation and remediation workflows.
- Flexible deployment options: Can be deployed in cloud, hybrid, or on-premises environments while maintaining consistent functionality.
- Built-in data routing and pipeline management: Allows teams to control log flows, manage data pipelines, and optimize storage without additional tools.
- Integrated dashboards and search capabilities: Provides tools for visualization, investigation, and reporting to support security and operational use cases.

Observability, Monitoring and Hybrid Operations Tools
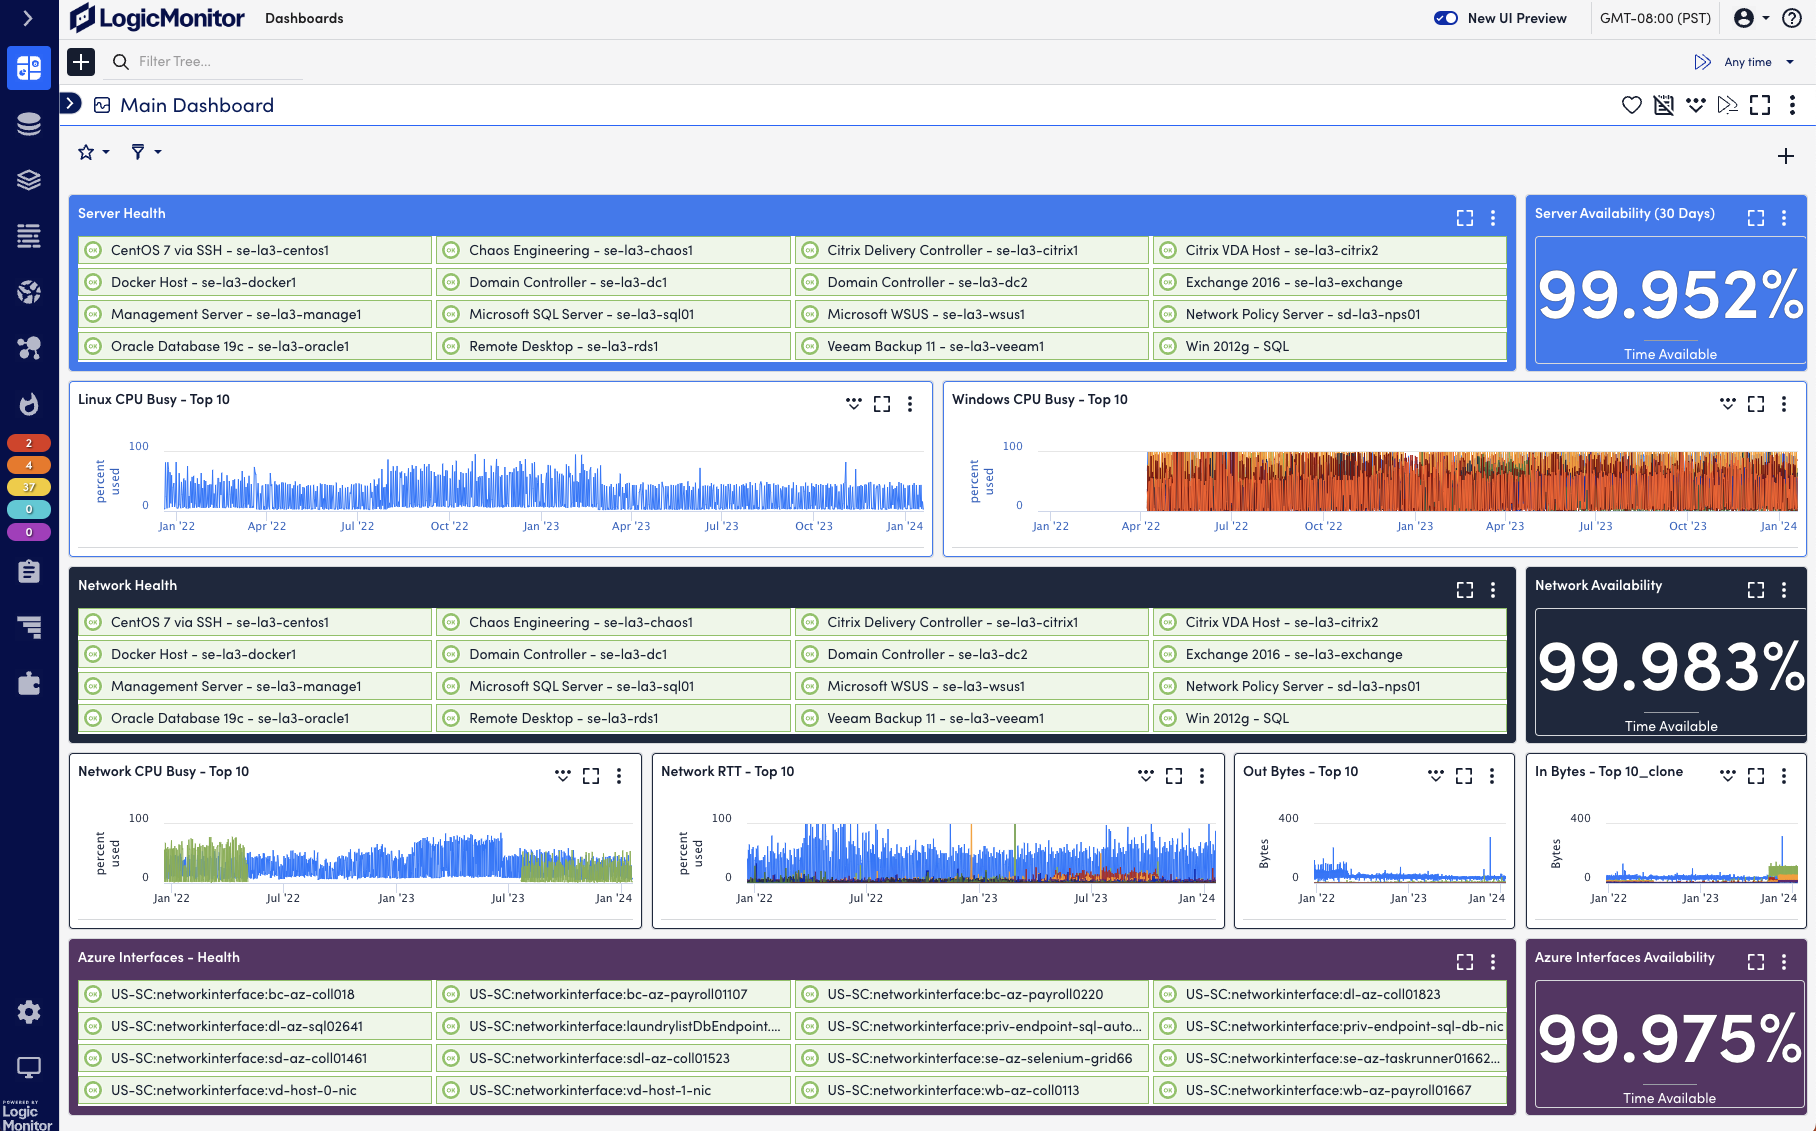
4. LogicMonitor

LogicMonitor is an observability platform that monitors hybrid IT environments, including on-premises infrastructure and cloud services. It focuses on providing unified visibility and uses AI-driven capabilities to detect issues early, correlate events, and support faster troubleshooting across systems.
LogicMonitorの主な特徴:
- Unified hybrid observability: Delivers visibility across data centers, cloud platforms, and infrastructure components within a single platform.
- AI-driven anomaly detection and root cause analysis: Uses AI to identify issues, correlate events, and reduce alert noise.
- Log and metric correlation: Combines logs, metrics, alerts, and resource data to provide context for troubleshooting.
- Extensive integration coverage: Supports thousands of integrations across on-premises and multi-cloud environments.
- Rapid deployment with collector-based monitoring: Enables quick setup and visibility into environments with minimal configuration.

5. Datadog

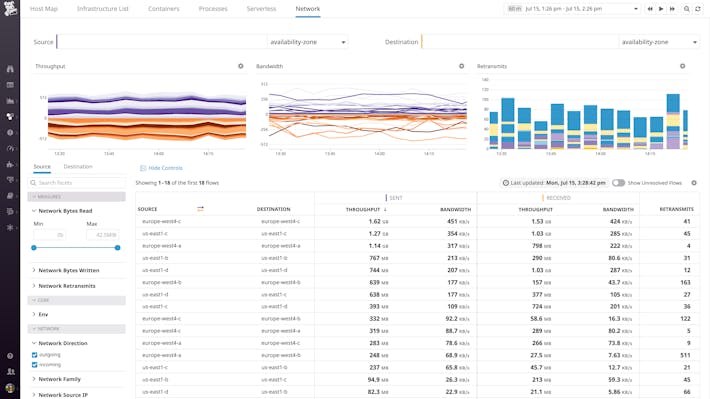
Datadog is a cloud-native platform that combines monitoring, observability, and security capabilities. It enables teams to track system performance, analyze logs, and detect security issues across distributed environments. The platform aims to provide visibility into modern applications, infrastructure, and services at scale.
Datadogの主な特徴:
- Full-stack observability: Monitors infrastructure, applications, logs, and user activity across cloud and hybrid environments.
- Integrated security monitoring: Includes capabilities such as cloud SIEM, vulnerability management, and application security.
- Wide range of integrations: Supports hundreds of integrations with cloud providers, services, and tools for unified visibility.
- Real-time monitoring and alerting: Provides alerts, dashboards, and analytics for tracking system behavior and incidents.
- Support for modern architectures: Covers containers, serverless environments, and distributed systems with specialized monitoring tools.

6. New Relic

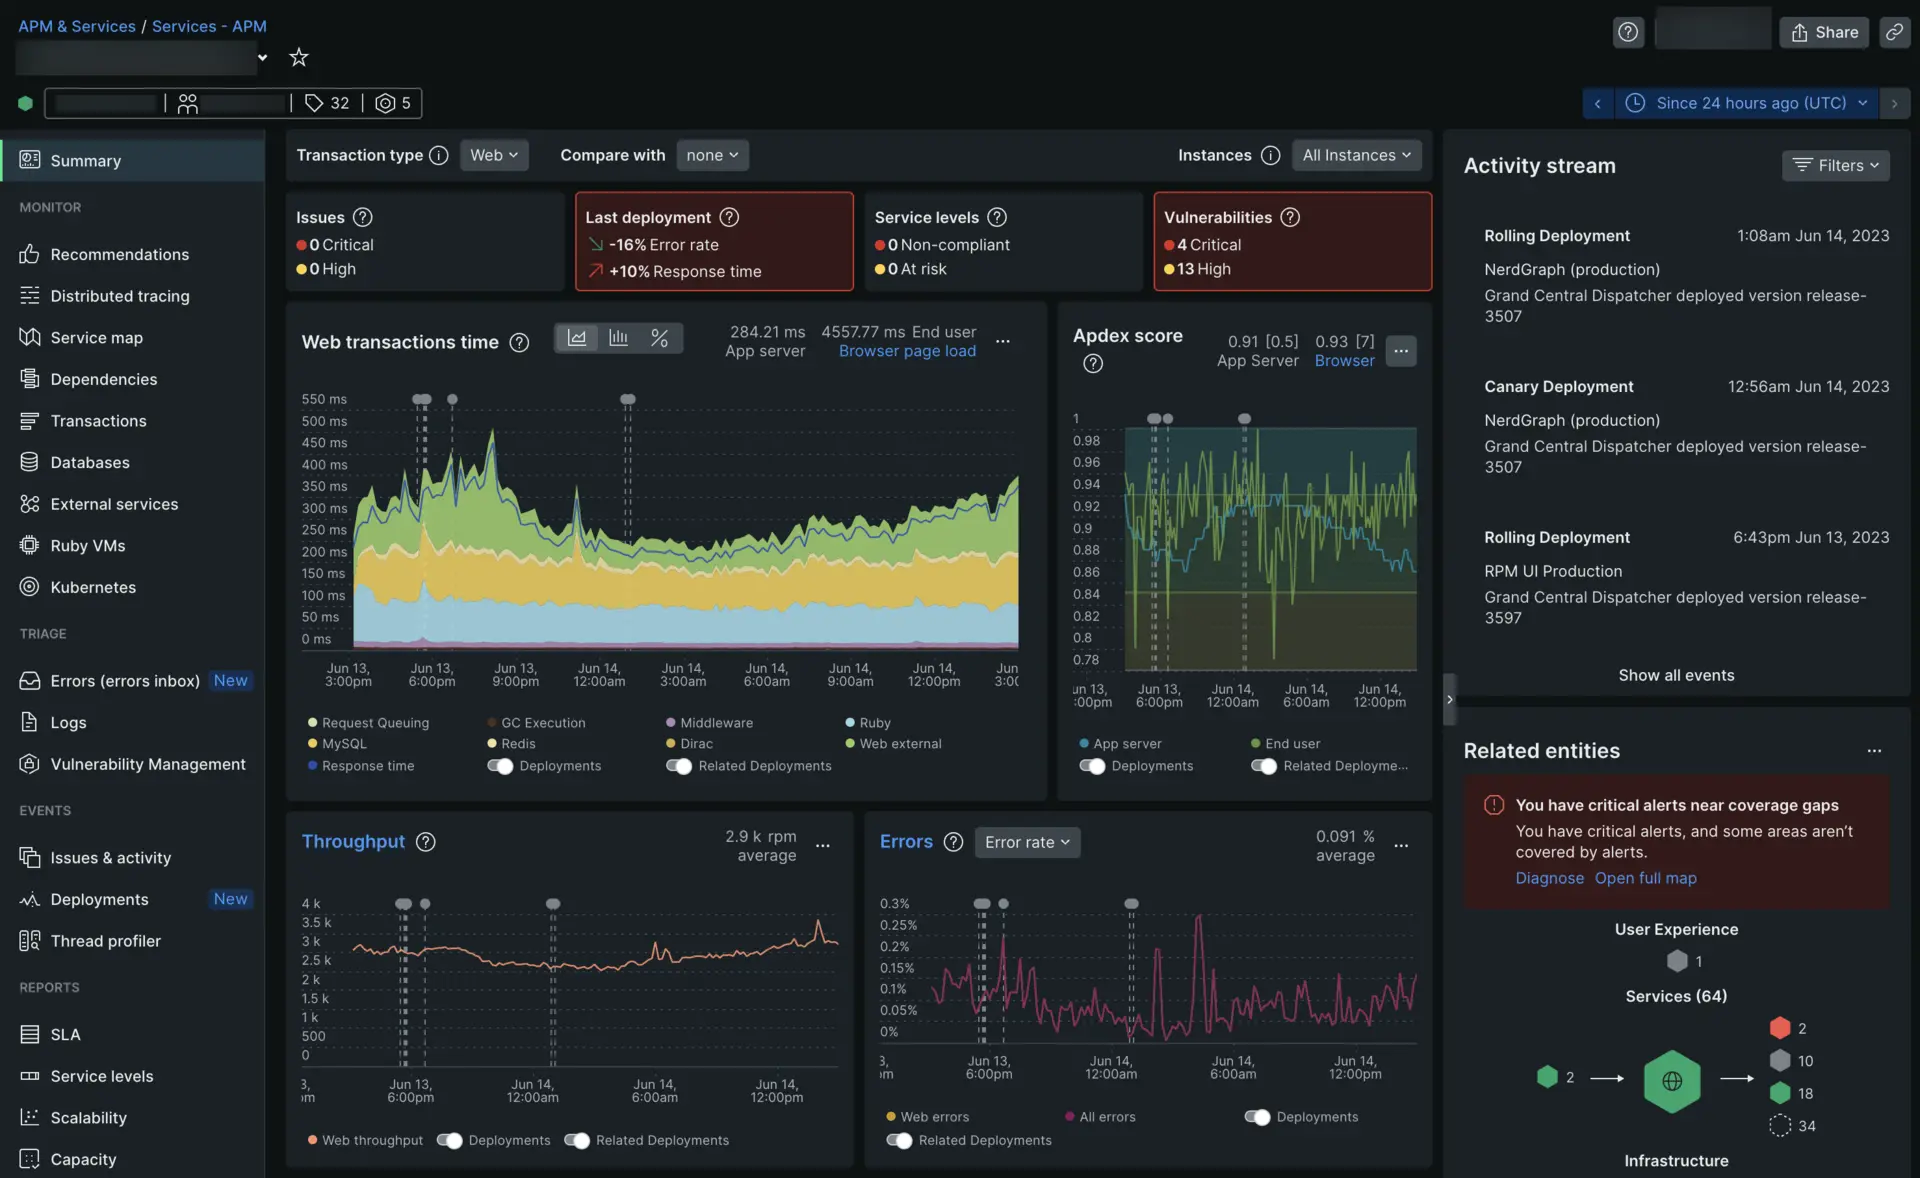
New Relic is an observability platform that provides visibility into applications, infrastructure, and user experiences. It aggregates telemetry data from across the stack and presents it through dashboards and analytics tools. The platform supports real-time monitoring and troubleshooting, helping teams identify and resolve issues across distributed systems.
主な特徴
- End-to-end stack monitoring: Provides visibility into applications, infrastructure, networks, and user interactions from a single platform.
- Real-time data collection and analysis: Ingests and analyzes telemetry data continuously to support fast issue detection and resolution.
- Integrated dashboards and alerting: Combines visualization, alerting, and analytics tools for monitoring system performance.
- Extensive integration support: Offers hundreds of integrations and supports open standards like Opentelemetry for data ingestion.
- Usage-based pricing model: Allows organizations to scale monitoring based on actual usage without fixed licensing constraints.
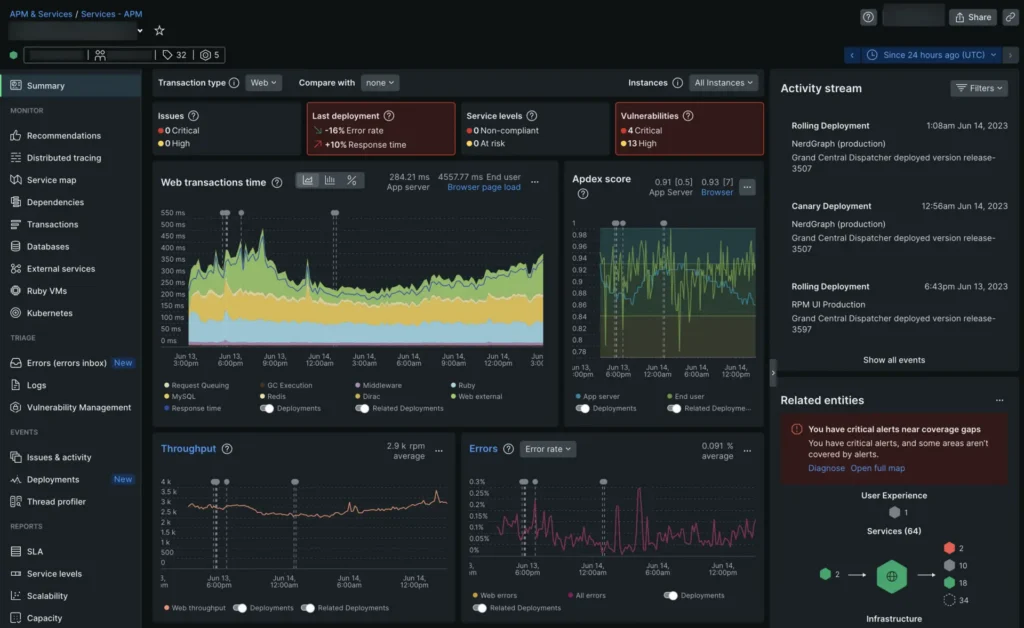
Source: New Relic
結論
Sumo Logicは、ログ分析、可観測性、セキュリティのためのプラットフォームを提供し、運用効率、セキュリティ体制、コンプライアンスを強化するツールを提供する。拡張性、機械学習主導の洞察、柔軟性を提供する一方で、潜在的なユーザーは学習曲線、統合ギャップ、コストの複雑さを考慮する必要がある。Sumo Logicを他の選択肢と比較することで、企業はニーズと目標に従って十分な情報に基づいた決定を下すことができる。
情報セキュリティの主要トピックに関するその他のガイドを参照
コンテンツ・パートナーとともに、私たちは、以下の世界を探検する際にも役立つ、いくつかのトピックに関する詳細なガイドを執筆しています。情報セキュリティ.
SIEMツール
著者:Exabeam
- [ガイド[ SIEMツール:SIEMプラットフォームトップ5、機能、ユースケース、TCO
- [ガイド】オープンソースの無料SIEMツールトップ5【2025年最新版
- [ガイド] ベストSIEMソリューション:SIEMシステムトップ10と2025年の選び方
ボット保護
著者:ラドウェア
アプリケーション・セキュリティ
著者:オリゴ