
-
- Home
>
-
- Explainers
>
-
- Splunk
Understanding Splunk Enterprise Security: Solution Overview
- 9 minutes to read
Table of Contents
What Is Splunk Enterprise Security?
Splunk Enterprise Security (ES) is a security information and event management (SIEM) solution. It helps organizations identify, investigate, and respond to security threats. Using big data analytics, Splunk ES provides real-time insights into security events across an organization’s IT infrastructure.
Splunk ES integrates with various data sources to collect, analyze, and visualize security information. This integration allows security teams to monitor, detect, and counter potential threats proactively. The solution’s dashboards and reports support security analysts in tasks like threat triage, investigation, and response.
This is part of a series of articles about Splunk SIEM
Key Features of Splunk Enterprise Security
Splunk Enterprise Security offers features aimed at enhancing an organization’s security capabilities. It includes real-time monitoring and alerting, enabling detection and response to security incidents. Additionally, the solution provides threat detection capabilities by employing machine learning and analytics to hopefully identify potential security anomalies.
Real-Time Monitoring and Alerting
Real-time monitoring and alerting in Splunk Enterprise Security are pivotal for threat detection and response. The platform analyzes data from across the IT environment, identifying potential security incidents as they arise. This 24/7 monitoring alerts on suspicious activity, intending to reduce the time to respond.
Alerting mechanisms within Splunk ES are customizable, which might allow organizations to tailor notifications to their specific security policies and risk thresholds. By configuring alerts based on precise criteria, security teams might be able to prioritize incidents that require immediate attention. This alerting process ensures resources are efficiently utilized, focusing on the most critical security threats.
Advanced Threat Detection
Advanced threat detection in Splunk Enterprise Security utilizes machine learning algorithms and statistical models to uncover hidden threats within large datasets. This feature goes beyond traditional rule-based detection methods, which could at times enable the identification of unconventional attack vectors and zero-day vulnerabilities by recognizing patterns indicative of malicious activities.
The platform’s machine learning capabilities evolve by learning from past security events, improving the accuracy of threat detection over time, enabling effective threat prevention strategies.
Incident Investigation and Response
Splunk Enterprise Security’s incident investigation and response capabilities allow security teams to explore and address security incidents. It provides visibility into security events, helping analysts to piece together the sequence of actions that led to an incident. This look into the data might clarify an understanding of attack vectors.
The response aspect of Splunk ES leverages automated workflows to facilitate containment and remediation of identified threats. These workflows guide security teams through well-defined procedures, minimizing human error.
Risk-Based Analytics
Risk-based analytics in Splunk Enterprise Security enhance threat detection by evaluating the risk level associated with different security events. This feature prioritizes security incidents based on their potential impact, allowing security teams to focus their efforts on high-risk threats potentially.
The platform synthesizes data from multiple sources to ascertain the risk context for threat prioritization.
Threat Intelligence Integration
The integration of threat intelligence into Splunk Enterprise Security might help to identify known malicious actors and tactics. By incorporating threat intelligence feeds, organizations can be alerted to the presence of threats recognized in the cyber landscape.
Threat intelligence feeds deliver up-to-date information on global threats, which is crucial for maintaining an effective security posture against evolving cyber threats. The collected intelligence may give security teams knowledge regarding potential threats and adjust their defenses accordingly.
Splunk Enterprise Security Pricing Models
Splunk Enterprise Security (ES) offers two main pricing models: workload pricing and ingest pricing.
Workload Pricing
Workload pricing aligns costs with the compute resources used for search and analytics workloads, rather than focusing on the volume of data ingested. This model may be ideal for organizations that prioritize efficiency in data processing and want better control over their computing capacity. It measures consumption using metrics like Splunk Virtual Compute (SVC) units for cloud products or virtual central processing units (vCPUs) for on-premises solutions.
This pricing model allows for greater scalability and flexibility, enabling organizations to adjust as their needs evolve across various use cases such as security, IT, and development operations (DevOps). Annual subscriptions are offered for Splunk Cloud Platform, while term licenses are available for on-premises deployments.
Ingest Pricing
Ingest pricing is based on the amount of data ingested into Splunk, measured in gigabytes per day (GB/day). This model may be suitable for customers with predictable data ingestion patterns, allowing them to scale their capacity by purchasing additional data volumes as needed.
Term licenses are available for on-premises deployments, while annual subscriptions are available for cloud-based solutions.
How Splunk Enterprise Security Works: Interface Overview
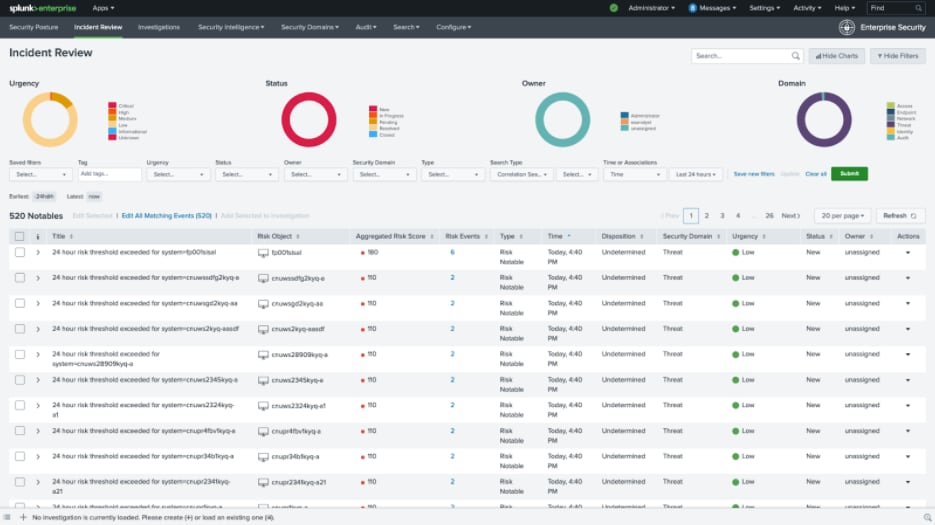
Incident Review
The Incident Review dashboard in Splunk Enterprise Security serves as the central hub for managing and analyzing security incidents, referred to as “notable events.” These events are generated when a correlation search detects anomalous or suspicious activity across data sources, such as spikes in network usage, unauthorized access attempts, or communication with known malicious servers.
Security analysts use the dashboard to monitor, triage, and investigate these events. It provides a detailed overview of each notable event, including its severity, source, and potential impact. Analysts can filter and prioritize events, assign them to team members for investigation, and track the status of each incident.
The typical workflow for incident review in Splunk Enterprise Security is designed to streamline the process of identifying and resolving security incidents:
- Initial triage: An administrative analyst monitors the Incident Review dashboard, sorting and performing an initial triage on newly generated notable events. They filter events based on severity and relevance, determining which ones need further investigation.
- Assignment: Notable events that require detailed investigation are assigned to a security analyst. The event status is updated from “New” to “In Progress.”
- Investigation: The assigned analyst gathers additional information on the notable event by exploring related data fields, running queries, and possibly using adaptive response actions. They document their findings in the Comments field, providing insights that may lead to a deeper investigation if necessary.
- Remediation: Once the cause of the incident is identified, the analyst works to remediate the issue or escalate it to other teams if further action is needed. After addressing the root cause, they mark the event as “Resolved.”
- Verification: A final analyst reviews the steps taken to resolve the incident, ensuring the issue has been properly addressed. If everything checks out, they close the event by updating its status to “Closed.”

Investigations
Investigations in Splunk Enterprise Security provide a collaborative environment for analyzing security incidents. Through the Investigation Workbench, security teams can document every step taken during an investigation, ensuring a comprehensive record of actions, artifacts, and findings.
Starting and Managing Investigations
To begin an investigation, analysts can create an investigation from a notable event, an alert, or even external notifications like emails or help desk tickets. Once started, investigations are managed through the Investigations Page, where analysts can view, filter, and track the progress of all incidents assigned to them. For teams that need to collaborate, additional colleagues can be added as collaborators to the investigation, allowing multiple analysts to work together on the same case.
Conducting Investigations on the Workbench
The Investigation Workbench is where the actual work takes place. Analysts can add artifacts to the investigation scope, including details about affected assets or other relevant events. As investigations progress, the workbench provides tabs and panels to help visualize and contextualize the data. Analysts can also use this space to conduct searches, adding useful queries from their action history or focusing on specific elements like assets or identities.
Documenting and Collaborating
Throughout the investigation, analysts can add notes, artifacts, and relevant files—such as screenshots or forensic evidence—directly into the workbench. This documentation ensures that every step of the investigation is recorded. Analysts can also collaborate with team members by sharing insights, filtering actions, or even notable events that may be related to the ongoing case.
Closing and Sharing Investigations
Once the investigation is complete, analysts can close the case, along with any associated notable events. The investigation summary provides a comprehensive overview of the entire process, which can then be shared with stakeholders or archived for future reference.

Risk Analysis
Risk analysis in Splunk Enterprise Security (ES) helps organizations assess the relative risk of devices, users, or other network entities by aggregating risk events over time. The platform assigns risk scores to these entities based on their activities, providing a single metric to represent their overall risk within the network environment.
A risk score is a cumulative measure that reflects the potential threat posed by a system, user, or other object. Splunk ES calculates these scores using correlation searches that monitor network activity and match suspicious patterns to predefined rules. When such a match is found, it triggers either a notable event or a risk modifier:
- Notable events are alerts that require immediate review, investigation, and closure by security teams.
- Risk modifiers adjust the risk score of an entity based on the detected activity. They contribute to the overall risk score, helping organizations track small, potentially overlooked actions that, when combined, may indicate a larger threat.
Risk scores in Splunk ES are scaled between 20 and 100 based on the severity of the identified activity. These scores provide a clear indication of risk levels and help security teams prioritize their response based on the urgency of the threat.

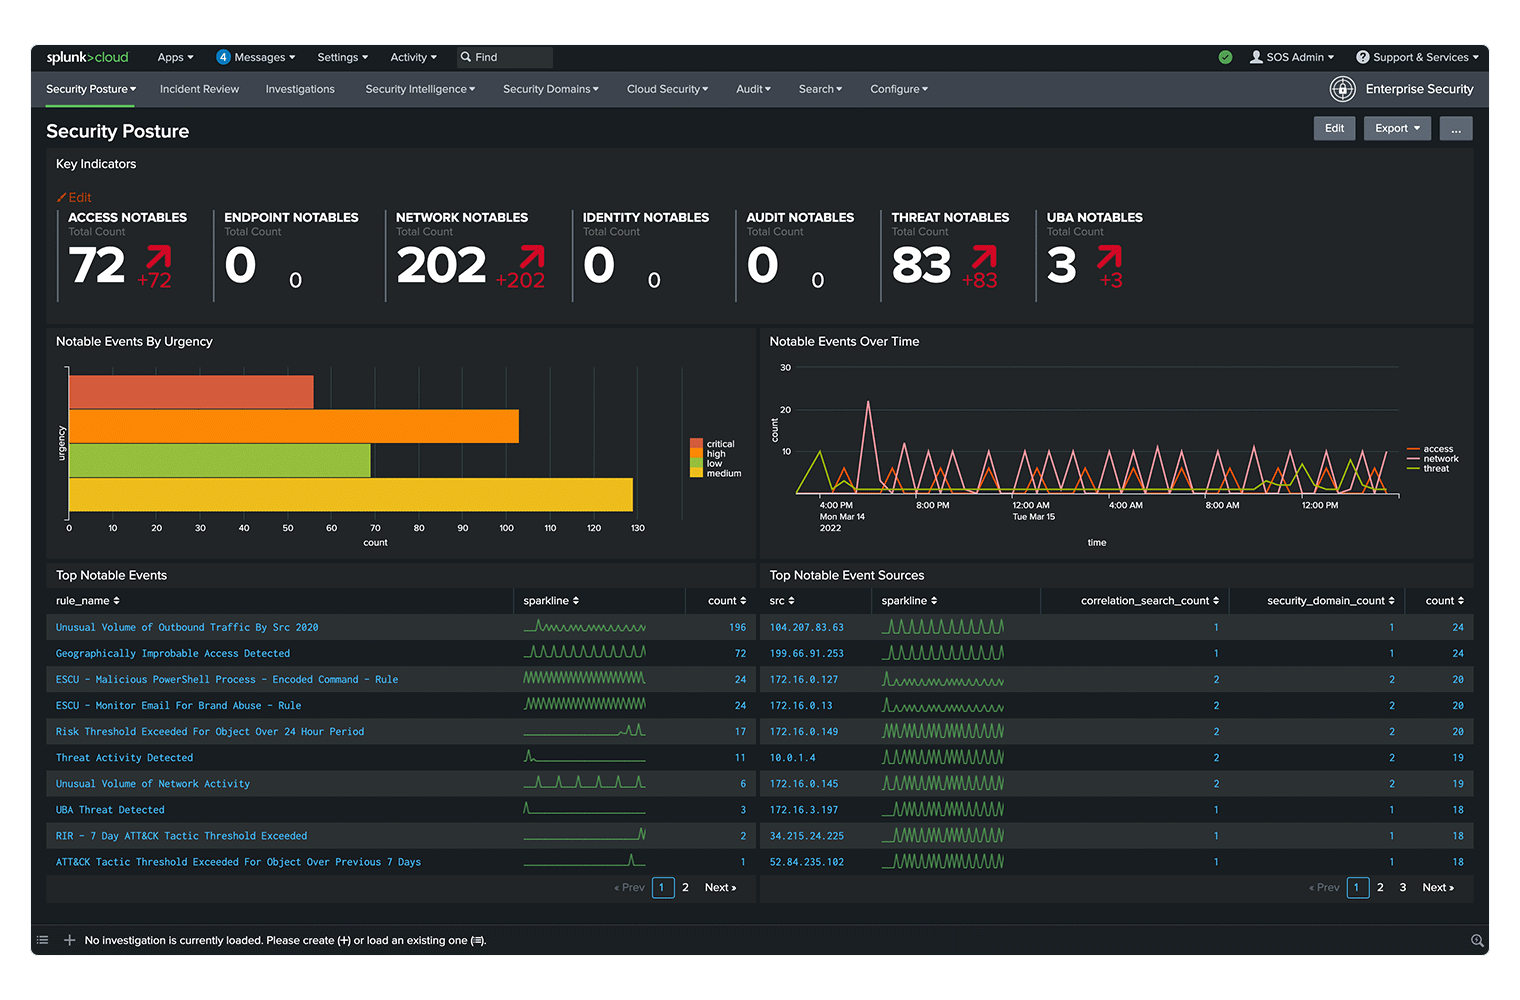
Dashboards
Splunk Enterprise Security (ES) offers over 100 dashboards that provide different views of security-related data, helping organizations identify, investigate, and manage security incidents effectively. These dashboards are customizable, to potentially enable users to tailor them based on specific security needs and operational roles. The dashboards can be broadly categorized into those for incident identification and investigation, security intelligence, and domain-specific monitoring.
Incident Identification and Investigation Dashboards
Splunk ES uses correlation searches to detect security events, which are then displayed on various dashboards to help analysts identify and investigate incidents.
- Security posture: This dashboard provides a high-level summary of notable events within the last 24 hours, highlighting the security domains with the most incidents and the most recent activity. It gives analysts a quick overview of their organization’s security health.
- Incident review: This dashboard is used to examine the details of notable events identified in the environment. Analysts can triage, assign, and investigate these events directly from the dashboard, streamlining the incident response process.
- My investigations: Analysts can use this dashboard to track ongoing investigations, manage multiple incidents, and document their progress. It offers a centralized view of all investigations, making it easier to keep track of related security events.
Security Intelligence Dashboards
These dashboards enhance incident investigations by providing insights into specific aspects of security data.
- Risk analysis: This dashboard visualizes the risk scores assigned to devices, users, and systems, helping security teams focus on high-risk entities and prioritize investigations accordingly.
- Protocol intelligence: It displays data from packet capture sources, offering insights into network traffic, such as suspicious DNS activity, unusual email traffic, or uncommon protocols being used. This helps identify potentially harmful network behavior.
- Threat intelligence: Using data from integrated threat intelligence feeds, this dashboard identifies known malicious actors within the environment, providing additional context for ongoing investigations.
- User intelligence: This dashboard helps track user and asset activity, including investigating user behavior, asset changes, and access patterns, which can help detect insider threats or compromised accounts.
- Web intelligence: Analysts can analyze web traffic, identify unusual HTTP categories, and detect suspicious user agents or domains. This dashboard is crucial for monitoring external interactions and potential web-based threats.
Security Domain Dashboards
These domain-specific dashboards provide monitoring for key areas within an organization’s security landscape, summarizing events and offering tools for deeper investigation.
- Access dashboards: These dashboards track authentication and access-related events, such as login attempts, access control violations, and default account activity. They help identify unauthorized access attempts or misconfigurations in access control.
- Endpoint dashboards: Focusing on endpoint security, these dashboards provide data on malware infections, patch statuses, system configurations, and more. They enable analysts to monitor the health and security posture of endpoints across the network.
- Network dashboards: These dashboards monitor network traffic from firewalls, routers, intrusion detection systems (IDS), and other network devices. They provide insight into network flows, vulnerabilities, and protocol usage, helping detect abnormal traffic patterns or potential breaches.
- Identity dashboards: These dashboards display data from asset and identity lists, focusing on session types and identity management. They are essential for tracking user authentication and asset relationships.

Splunk Enterprise Security Limitations
While Splunk Enterprise Security (ES) provides tools for threat detection and incident management, there are several limitations that organizations should be aware of. These challenges were shared by users on the G2 platform:
- High cost: Splunk ES can be expensive, especially for large enterprises, as licenses are required for each user and costs are based on consumption, and can grow significantly as organizations scale up.
- Complex licensing model: The licensing structure is often seen as difficult to manage and control, making it a challenge for some organizations to optimize costs effectively.
- Resource intensive: Handling complex queries can consume significant system resources, leading to slower performance and increased operational overhead.
- Performance delays: Users may experience delays in log display, with the platform occasionally taking longer than expected to retrieve data.
- Limited free version: While a free version of Splunk is available, it offers very limited functionality, making it impractical for most enterprise-level use cases.
- Learning curve: New users often face a steep learning curve, particularly with the Splunk Programming Language (SPL), which requires specialized knowledge to use effectively.
- Web application stability: The desktop application generally performs better than the web interface, which can sometimes crash, particularly during resource-heavy operations.
Exabeam: Ultimate Alternative to Splunk
Exabeam is a leading provider of security information and event management (SIEM) solutions, combining UEBA, SIEM, SOAR, and TDIR to accelerate security operations. Its Security Operations platforms enables security teams to quickly detect, investigate, and respond to threats while enhancing operational efficiency.
Key Features:
- Scalable log collection and management: The open platform accelerates log onboarding by 70%, eliminating the need for advanced engineering skills while ensuring seamless log aggregation across hybrid environments.
- Behavioral analytics: Uses advanced analytics to baseline normal vs. abnormal behavior, detecting insider threats, lateral movement, and advanced attacks missed by signature-based systems. Customers report that Exabeam helps detect and respond to 90% of attacks before other vendors can catch them.
- Automated threat response: Simplifies security operations by automating incident timelines, reducing manual effort by 30%, and accelerating investigation times by 80%.
- Contextual incident investigation: Since Exabeam automates timeline creation and reduces time spent on menial tasks, it cuts the time to detect and respond to threats by over 50%. Pre-built correlation rules, anomaly detection models, and vendor integrations reduce alerts by 60%, minimizing false positives.
- SaaS and cloud-native options: Flexible deployment options provide scalability for cloud-first and hybrid environments, ensuring rapid time to value for customers. For organizations who can’t, or won’t move their SIEM to the cloud, Exabeam provides a market-leading, full featured, and self-hosted SIEM.
- Network visibility with NetMon: Delivers deep insight beyond firewalls and IDS/IPS, detecting threats like data theft and botnet activity while making investigation easier with flexible searching. Deep Packet Analytics (DPA) also builds on the NetMon Deep Packet Inspection (DPI) engine to interpret key indicators of compromise (IOCs).
Exabeam customers consistently highlight how its real-time visibility, automation, and productivity tools powered by AI, uplevel security talent, transforming overwhelmed analysts into proactive defenders while reducing costs and maintaining industry-leading support.
Learn More About Exabeam
Learn about the Exabeam platform and expand your knowledge of information security with our collection of white papers, podcasts, webinars, and more.