How risk assessment for UEBA (user entity behavior analytics) works is not unlike how humans assess risk in our surrounding environment. When in an unfamiliar setting, our brain constantly takes in data regarding objects, sound, temperature, and weighs different sensory evidence against past learned patterns to determine if and what present risk is before us. A UEBA system works in a similar manner. Data from different log sources, such as Windows AD, VPN, database, badge, file, proxy, endpoints are ingested. Given these inputs and learned behaviors, how do we fuse the information to make up a final score for risk ranking?
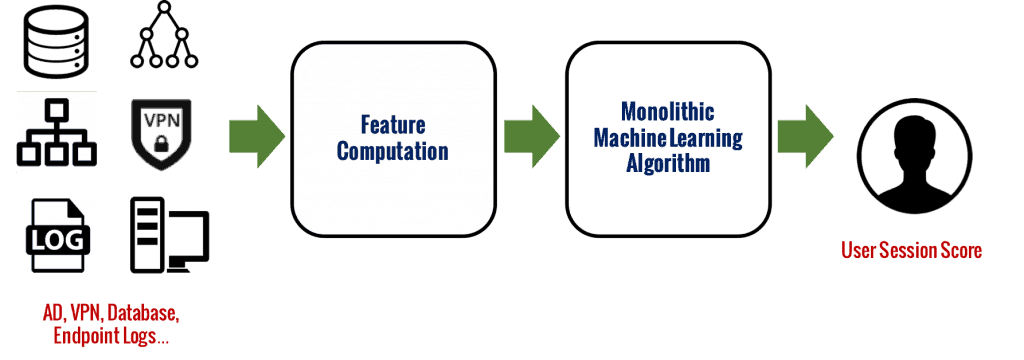
Before we dive deeper, let me first share some general thoughts on the construction of security analytics systems to frame the question better. When I started working in the security field, my first instinct as a data scientist was to traditionally define some learning features which are generally numeric in values as inputs to an available machine learning algorithm (SVM, decision tree, and the like), to identify outliers or malicious entity sessions. But it soon became clear that such a conventional monolithic learning framework (Figure 1) has little chance for production success.
First, security data is heterogeneous and we cannot expect all data sources to be available from the start for learning purposes. This makes the construction of comprehensive features difficult, if possible at all. When a new data source is added, the need to retrain or retune the monolithic modeling makes it impractical for a production system. Second, the flexibility to quickly configure and deploy learning features is extremely important. It is impractical to relearn a single-algorithm system every time new features are to be added. Third, even if it exists, an over-encompassing monolithic learning algorithm using a wide variety of data for malicious event detection tends to be a black-box approach. This goes against the must-have user requirement that output must be easily explained and interpreted.

Figure 1: An example of a monolithic black-box scoring approach whose output lacks explainability.
So, it is not surprising that an effective security analytics system consists of statistical indicators or sensors that can be added to meet new data demands and are easy to interpret. As a result, instead of having an end-to-end monolithic framework, we have a collection of independent indicators. An explicit step is now needed to fuse the outputs together. Here’s the process.
Some indicators are based on statistical analysis for anomaly detection, for example, whether a user accessed an asset abnormally. Some are simply based on facts such as whether there is a malware alert found on an asset. Others involve machine learning such as detecting a DGA (domain generation algorithm) domain by bigram modeling or neural network. A few others rely on context derived by machine learning to aid anomaly detection, selecting the best peer group via behavior analysis for peer analysis for example. These indicators are designed to be as statistically independent as possible. At Exabeam, there are more than a few hundred such indicators across a variety of data types, each carefully developed according to security expertise, data science, and field experience.
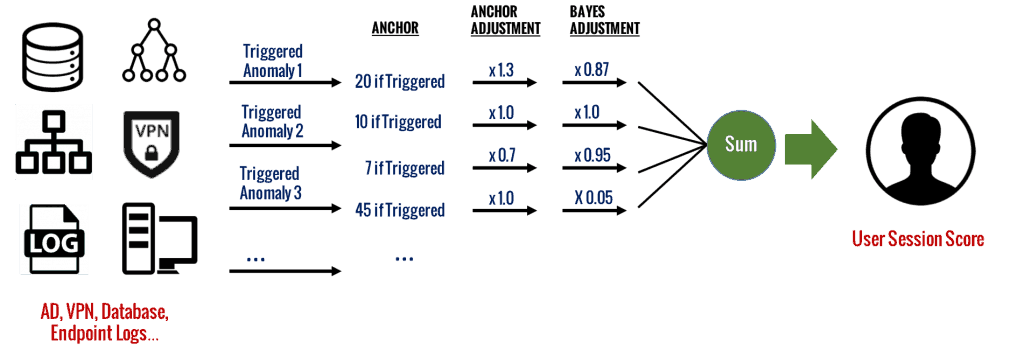
How do we now fuse these indicator outputs into a final session score? An obvious approach is to first assign a score to each triggered indicator; this “anchor score” is assigned by human experts based on their field experience and security research. Then, we simply sum up the scores from all the triggered indicators within a session to make up the final session score. However, this simple approach is not optimal across different environments. Some indicators are prone to trigger more across the user population, possibly due to environment-specific reasons. Some indicators tend to trigger more only for specific accounts; for example, first-time access alert to an asset by a service account. Indicators with frequent triggers are less informative in the security context than those that are rarely triggered. Frequently triggered indicators contribute to score inflation for sessions, resulting in an increase of false positive rate and a decrease in precision rate.
To mitigate the issue with score inflation, at Exabeam, an anchor score is first adjusted dynamically based on a variety of factors from the behavior profiles. See Figure 2. One example is the anchor score adjustment for peer group-based indicators; for example, if this is the first time for this user’s peer group to trigger an indicator, the corresponding anchor score is adjusted based on how close the user is related with the said peer group from the past activity histories.
The anchor score can be further modified to reduce the false positives associated with frequently triggered indicators. In Figure 2, we show another adjustment factor being applied to the anchor score. The adjustment factor is based on the Bayesian method to weigh the score contribution of indicators according to their historical triggering frequencies. The more frequent an indicator is observed to trigger in history, the smaller its adjustment weight is. Finally, the session score is the sum of all triggered indicators’ anchor scores, each weighted by its data-driven adjustment factors. The adjustments are dynamic and learned from data periodically.

Figure 2: A combined expert- and data-driven dynamic scoring framework used in modern UEBA solutions that reduces false positives by adjusting scores based on a variety of factors.
In summary, this example of a UEBA scoring system is both expert-driven and data-driven. Statistics, fact, or machine learning-based anomalies in a session initially have expert-assigned anchor scores. Each score is then calibrated depending on a variety of data factors specific to that anomaly. Finally, the Bayesian modeling is used to learn indicators’ triggering frequencies to enhance the precision of final output scores. This scoring process has performed well in the field, as it is also highly explainable for later investigations.
The mathematical details of various such calibrations are important and would be topics for future posts.
Similar Posts
Recent Posts
Stay Informed
Subscribe today and we'll send our latest blog posts right to your inbox, so you can stay ahead of the cybercriminals and defend your organization.
See a world-class SIEM solution in action
Most reported breaches involved lost or stolen credentials. How can you keep pace?
Exabeam delivers SOC teams industry-leading analytics, patented anomaly detection, and Smart Timelines to help teams pinpoint the actions that lead to exploits.
Whether you need a SIEM replacement, a legacy SIEM modernization with XDR, Exabeam offers advanced, modular, and cloud-delivered TDIR.
Get a demo today!


