-
- Home
>
-
- Blog
>
-
- InfoSec Trends
Extracting Actionable Information from Windows Events
- Feb 12, 2018
- Andy Skrei
- 7 minutes to read
Table of Contents
Within your corporate network, Windows event logs are a primary source of information that is critical to understanding user behavior and emerging security threats. But examining events individually does not provide the comprehensive picture that lets you see unusual or suspicious behaviors. Part of the problem is that there are a lot of events—more than 1600. You need to know which ones are important and which ones can be safely ignored. Another part of the problem is that each event has its own format that often is not consistent with the format of other events. For example, some events might contain a source IP address, while others might refer to a destination IP address. In most cases, what you really want are the host names of the source and destination computers.
The problem of working with raw Windows events
You’d think it would be a simple matter to look at your Windows event logs to discover important security patterns, such as, “When did user Barbara Salazar first log into her computer today, and was she in our office, or at home, or somewhere else?” Or, “Was it really Barbara Salazar, or someone impersonating her and getting forbidden access to company resources?” Or, “Who connected to our local network at a time when local users typically do not connect, and which network resources did they access?” This kind of information is critical in diagnosing whether your users are operating within normal patterns, or whether an internal or external attack is underway.
The information that you need in order to answer these questions is mostly contained in the Windows event logs, if only it were possible for mere humans to find it and make sense of it. But finding the critical tidbits of information amongst both important and irrelevant details in the log files is an especially difficult problem. And without the proper tools, trying to be proactive in detecting preventing attacks can be an exercise in futility.
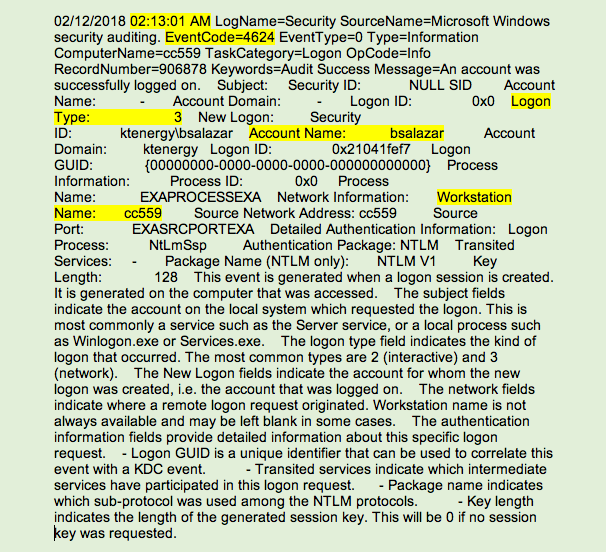
Figure 1 is an example of Windows event 4624, which is logged on the local computer after each successful account login. As you can see, it isn’t particularly easy to read, but it contains critical information, somewhat hidden among a lot of superfluous information.
Because event 4624 is logged locally by every workstation every time a logon event occurs, and is logged only on the workstation that is originating the logon request, it is not available on your domain controllers or in any other centralized location. The distributed nature of critical log data is why it is so important to stream all of your workstation and server logs, and not just your Domain Controller logs, to a data lake.Figure 1. Windows event code 4624 for user Barbara Salazar connecting to a shared network folder
In our example, event 4624 with logon type=3 means that the user connected to a shared network folder. This event has 8 other numerical logon type values. You could memorize these logon type codes or use a cheat sheet to look them up. But as we mentioned before, event 4624 is only one of more than 1600 Windows event codes. And just this one event might be logged millions of times per day in a large network.
The sheer number of Windows event codes and the volume at which they are logged in corporate networks are too much for any one person to examine and evaluate. It’s also difficult to know which codes are important and therefore should be audited. Often, network security teams think they are auditing the right codes, and it turns out that they are ignoring important codes that could be revealing critical clues to undesirable user behaviors.
If you are interested in event codes and their detailed contents, you can examine a complete list of Windows events by using the excellent Security Log Encyclopedia on Randy Franklin Smith’s Ultimate Windows Security web site.
Here are some additional barriers to monitoring your network using raw Windows logs:
- Many log events are not important. For example, out of every 20,000 events that are logged, there might be only 1,000 events that have any statistical significance for uncovering suspicious or undesirable behavior.
- Much of the log content is not useful for security purposes, and often the content is not clearly defined.
- The logs do not contain the same information across event codes. Some contain a source IP address, others a host name.
- Many events, like the one in our example, are logged only locally on the affected workstation, while others are logged only by domain controllers.
- Some events have multiple instances of the same variable, such as Account Name. You need to understand the log entries deeply enough to know which account name is performing an action, and which account name the action is being performed against.
Compounding your ability to track user sessions is the fact that most users do not completely log out when they leave for the day, resulting in their user credentials constantly authenticating off your domain controllers, 24 hours per day. If users do log off, their workstations log appropriate event codes. However, if they just lock their workstations without logging off (a common practice), a different event is logged in place of the expected event. This situation makes finding the first domain login event of the day very difficult.
So, we’ve established that making sense of the Windows event logs is a challenge for any SOC analyst. In fact, many companies collect these events on a continual basis, but don’t know how to derive any value from them.
Applying Advanced Analytics to Windows logs
Exabeam Advanced Analytics evaluates your network event logs together with other key sources of information, and then organizes and presents it on a timeline that we call as session. We build sessions for every user on the network every day. The resulting sessions can be accessed at any time for any user or filterable condition. Each session includes both normal and abnormal behaviors, and abnormal behaviors are assigned a point score. When the point score reaches 90 points, we send an alert. By quickly scanning this timeline presentation, you can see the entire picture of an attack as it progresses.
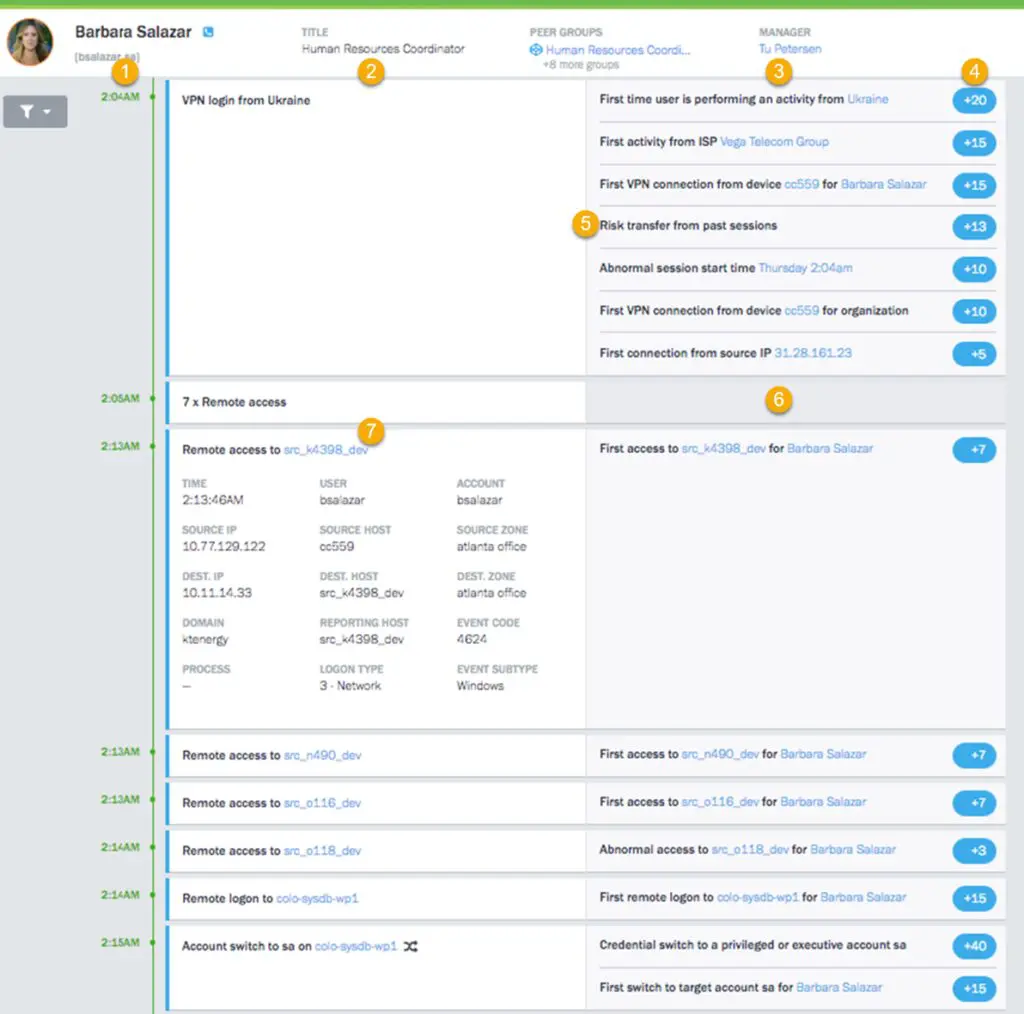
Let’s look at an example of the Advanced Analytics dashboard for the first 11 minutes of user Barbara Salazar’s activities of the day, beginning at 2:04 A.M. Figure 2 shows the dashboard for this portion of the session. A portion of this information was extracted from the event log shown in Figure 1. Other details came from other events and other sources.
In this session, each event type appears in the left main column (2). Multiple events of the same type are collapsed into a single entry until another event type occurs. The right main column (3) shows activities that our analysis has determined are outside the normal range of typical user behavior. Each of the activities in the right column adds a predetermined number of points to the session.
Legend
- Each session spans the time from the when the user logs in until they log off, or a maximum of 24 hours. The timestamp shows when each event type began and continues until another event type occurs.
- This column shows event instances in time. You can expand multiple-event entries (such as 7x Remote access) to see individual event details.
- This column shows activities that are risk behaviors that fall outside the acceptable behaviors of this user and typical users.
- Risk points are assigned to each suspicious behavior and appear in bubbles along the right edge of the window.
- If significant, risk points from previous sessions that exceed a certain threshold are added to the current session’s risk score.
- An empty cell indicates an event that is not suspicious.
- Events can be expanded to examine detailed information that has been extracted and inferred from multiple data sources.
During the first part of “Barbara’s” session, starting at 2:05 A.M., we determined that a first time login from the Ukraine was a significant risk and added 20 risk points. Furthermore, this was the first time that a login occurred from the Vega Telecom Group, and we added another 15 risk points. Yet another suspicious activity is that Barbara apparently logged in from a workstation named CC559, which was a first not only for Barbara, but for the entire organization. Together, these activities added another 25 risk points. Also, it’s unusual for Barbara’s first session of the day to start at 2:04 A.M. so that fact added another 10 risk points. Finally, we added 5 more risk points because no one has ever logged in from IP address 31.28.161.23.
Note the activity that we labeled in the illustration. This entry shows that there were risk points added in previous sessions, and based on analysis of those sessions, we transferred 13 risk points to the current session. Transferring risk points in this way ensures that we don’t miss slowly-unfolding attacks that might occur over days or weeks.
As of 2:05 A.M, we have added 88 points of risk to the session, and seven instances of remote access. None of those remote access instances are thought to be suspicious, and at this time, we don’t quite have the 90 points we need to trigger an alert.
But at 2:13 A.M., we can see that “Barbara” is starting to try some lateral moves around the network. We’ve expanded the first of these events (item ) to examine the details. Each of the detailed items is either derived from a Windows event or inferred from data consolidation and normalization that are applied by the Advanced Analytics engines. You can see all relevant details of the event, including host names that we infer based on our host mapping technology. Note that Windows event code 4624 and logon type 3 are included in this detailed information.
Note that this first lateral move, where the “Barbara” is probably trying to locate a network resource with higher privileges or some sort of valuable data, adds another 7 risk points, bringing the total to 95, which is enough to trigger an alert. At this point, we can assume that this user probably isn’t Barbara Salazar, but someone who has her credentials.
The session continues with additional lateral moves until our hacker soon gets privileged access to a DBMS system with system administrator credentials. Not only is this suspicious behavior, it is also the first time this user has attempted such a maneuver.
How Exabeam Advanced Analytics solves information overload from Windows logs
Windows logs when viewed in isolation do not provide a complete picture of what is happening in your network. Exabeam recognized this gap in security information, and developed Advanced Analytics to employ a more comprehensive solution. Advanced Analytics fills security information gaps by:
- Employing a security research team that has a deep understanding of event logs and how to make sense of them, including how information is related and spread across different events.
- Normalizing the data so that each data item contains consistent and well-defined information.
- Stitching Windows events and any other available log events and data feeds (SIEM/LMS security alerts, VPN, proxy, anti-malware sources, and others) into chronological timelines called sessions.
- Applying models and rules to the sessions through a series of engines to locate potential instances of threats to your network resources. The engines include a Context Engine, a Session Engine, a Behavioral Engine, and a Risk Engine.
The output of this processing is a risk score for each event in the session. Certain activities resolve to a static risk score derived by our security research team for those specific activities. Other anomalous activities are assigned a dynamic risk score based on various characteristics of the behavior. The end result is a more complete picture of risky and suspicious behavior across all of your network assets, regardless of whether the activities are based on internal or external events.
Exabeam Security Research Team (ESRT) Mission Statement:
The ESRT strives to provide unique insight into how we look at the world of cyberthreats and risk by highlighting the common patterns that different threats and threat actors use, and why we need to reorient our detections and priorities to tactics, techniques, and procedures (TTPs) vs. indicators of compromise (IOCs).
We aim to share a newer ideology of investigating threats by answering the following questions: “who, what, and how”.

Andy Skrei
Sr Director Product Management | Exabeam | Andy Skrei has over 15 years of experience in cyber security from practitioner to executive at Exabeam. Prior to joining Exabeam, Andy worked as a lead security engineer at eBay, developing and deploying technologies for its global SOC. Prior to eBay, he was a manager at KPMG, helping some of the largest organizations in the world increase security maturity and reduce risk. Andy has a unique view on how security analytics and a fresh look at the problems of the SOC can greatly increase our chances of success against advanced threats.
More posts by Andy SkreiLearn More About Exabeam
Learn about the Exabeam platform and expand your knowledge of information security with our collection of white papers, podcasts, webinars, and more.
-
 Blog
Blog
What’s New in New-Scale April 2026: Securing the Agentic Enterprise With Behavioral Analytics
- Show More