
What’s In a Good Story? Context, Plot and Discovery
- Jul 11, 2019
- Ron Collins
- 4 minutes to read
Table of Contents
Who doesn’t love a great story? Whether it’s told on screen, in a book or around a campfire, nothing fires up the imagination better. The other side of that coin, unfortunately, can be a bad story – a rambling, pointless, frustrating mess that ends up going nowhere, causing us to walk away confused and unsatisfied.
Welcome to the job of a SOC analyst….
Hundreds, maybe thousands of tales begin daily from the many different security tools we use. Our job is to try to understand what’s happening in each of these and mitigate any real threats. Sounds simple, huh?
It’s not…
It can be a horror story of trying to put together evidence as to what’s really happening. These clues can come from solutions that alerted the analysts in the first place, different tools, or better yet – their SIEM!
The sad reality is that tracking down these alerts in a SIEM can be an exercise in futility—and frustration. Query, pivot, query, pivot opens more questions than it answers. There is no context, no sense of the true timeline of the events and even worse, analysts don’t even know if they are asking the right questions.
A better plotline
Let’s look at this a different way, now. Let’s pan back and use risk as our starting point. In addition, we’ll add context to the risk and create a solid protagonist for our story. For our plot, we’ll use analytics to build out the story.
In a recent security incident, Exabeam Advanced Analytics introduced us to Barbara who appeared in the Exabeam platform as a Notable User. This simply means that her behavior had deviated enough from what the platform knows as normal for her, her peers and the organization as a whole and she accumulated 90+ points of risk.
Risk is based on understanding what is normal for each user or entity in the organization – not some arbitrary number of events in a certain time period. Exabeam models user activity to build this baseline of normal and score risk based on anomalies – not artificial correlations.

Figure 1: Exabeam Advanced Analytics flags Barbara Salazar as a Notable User.
As an analyst I can immediately select the user (Salazar, Barbara) and understand exactly who I am dealing with – it’s not an IP address or some security alert from an EDR tool. I have a “back of the baseball card” view of exactly who I am dealing with – name, role, location, peers, manager and probably most importantly – when this user has first been seen. The main question is: Is this a new user or someone established in the organization?
At a glance, I can quickly review all of the reasons for this score that landed Barbara on our radar.
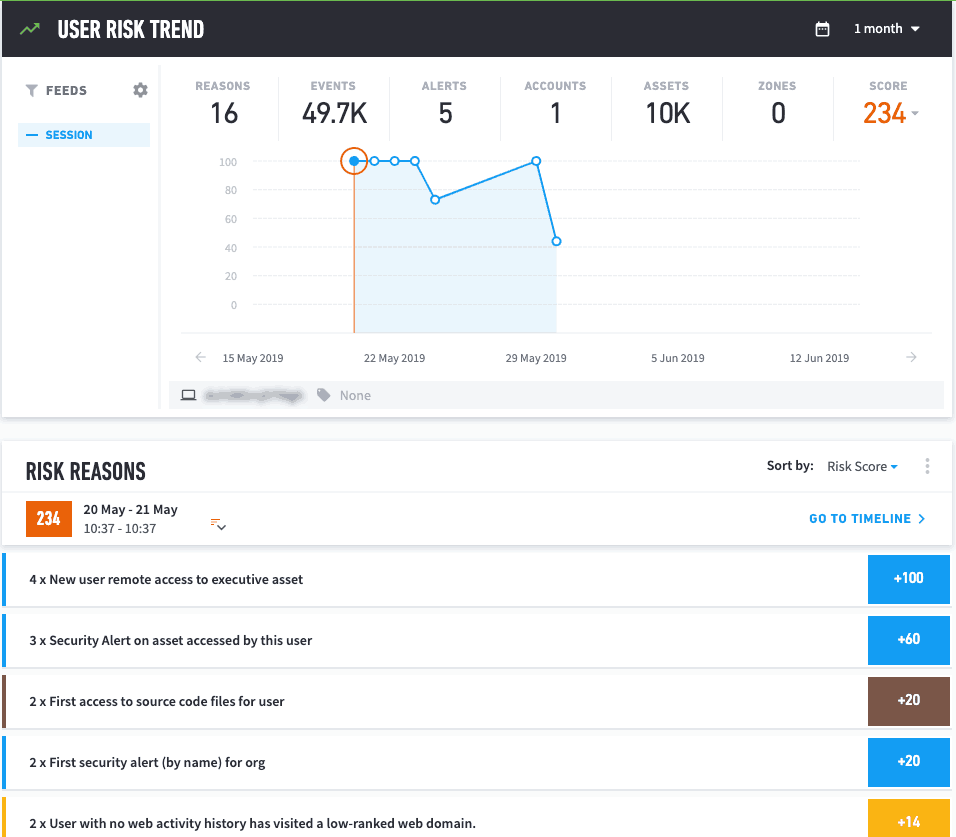
Figure 2: Smart Timelines presents the reasons for Barbara’s high-risk score: new remote access to executive asset, first access to scource code files and activity for a user with no web activity history.
In addition, we can also see that the risky behavior continued for a long period of time and was gathered from many different sources of data – web, Windows events and file information.
At this point, it’s like I have read the back cover of the book and it’s caught my attention – I’m buying it!
The plot thickens
So let’s start reading our story. I want to get into the details of what’s happening and what better way than investigating the timeline of this user?
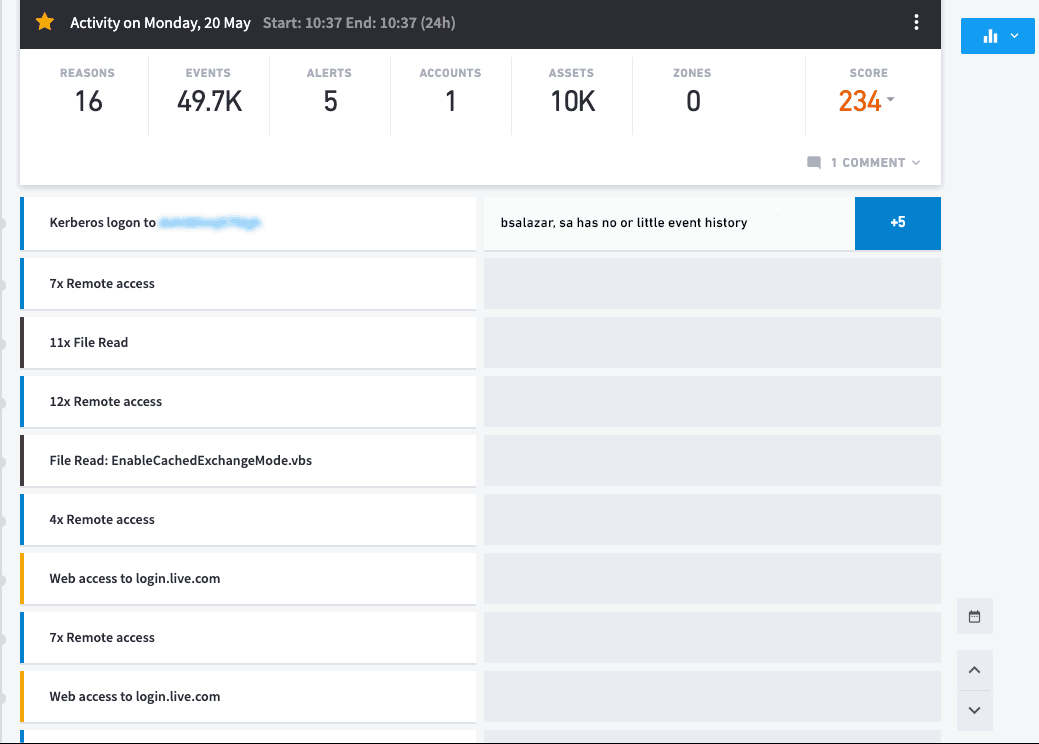
Figure 3: Exabeam Smart Timelines immediately presents the analyst with the sequence of events beginning with the user logging into the network.
You can immediately see where this user’s day began and answer many questions:
- Did the user log in remotely or locally?
- What data sources am I dealing with?
- KPIs in this user’s day – 16 instances of risky behavior, five third-party security alerts and this user connected to 10,000 assets during this period
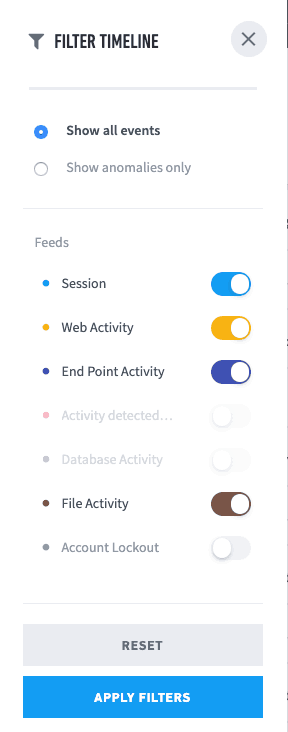
Figure 4: Filter your search to get information about user log in, data sources and file activity.
Now the plot thickens. I can see the system this user logged in to start her day isn’t her own:
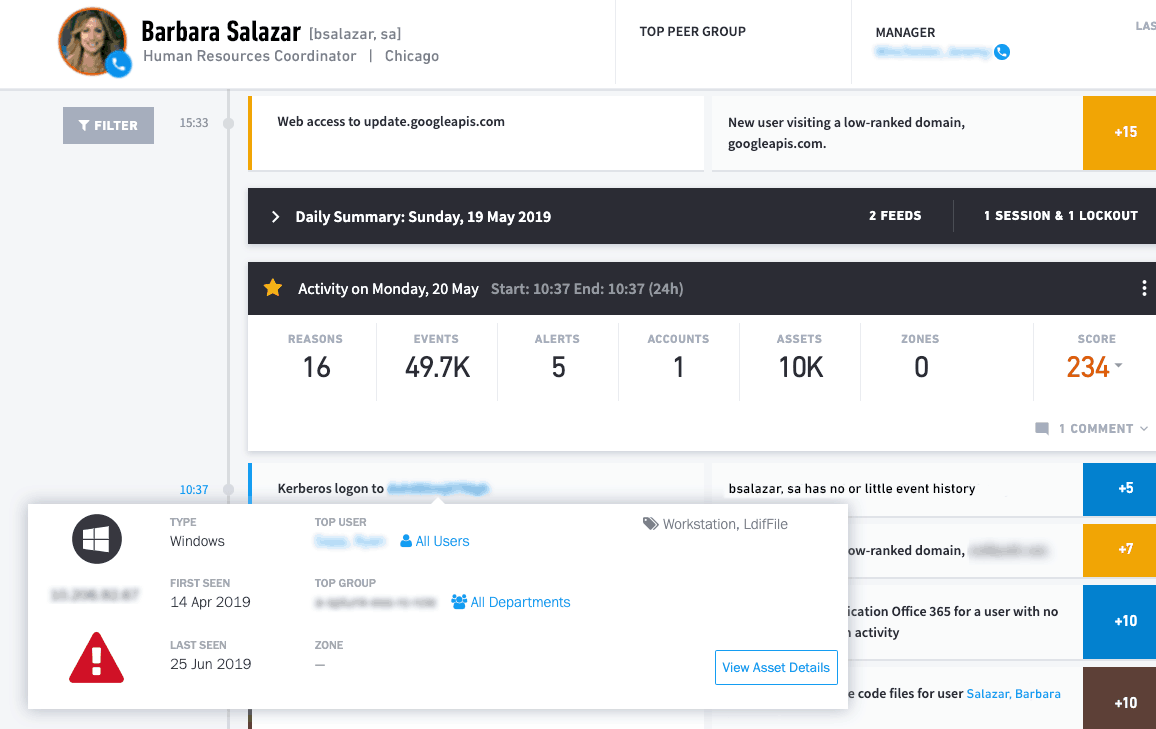
Figure 5: First Seen shows the user has logged in from a system that’s not her own.
I can immediately focus on the anomalies in the user’s session.
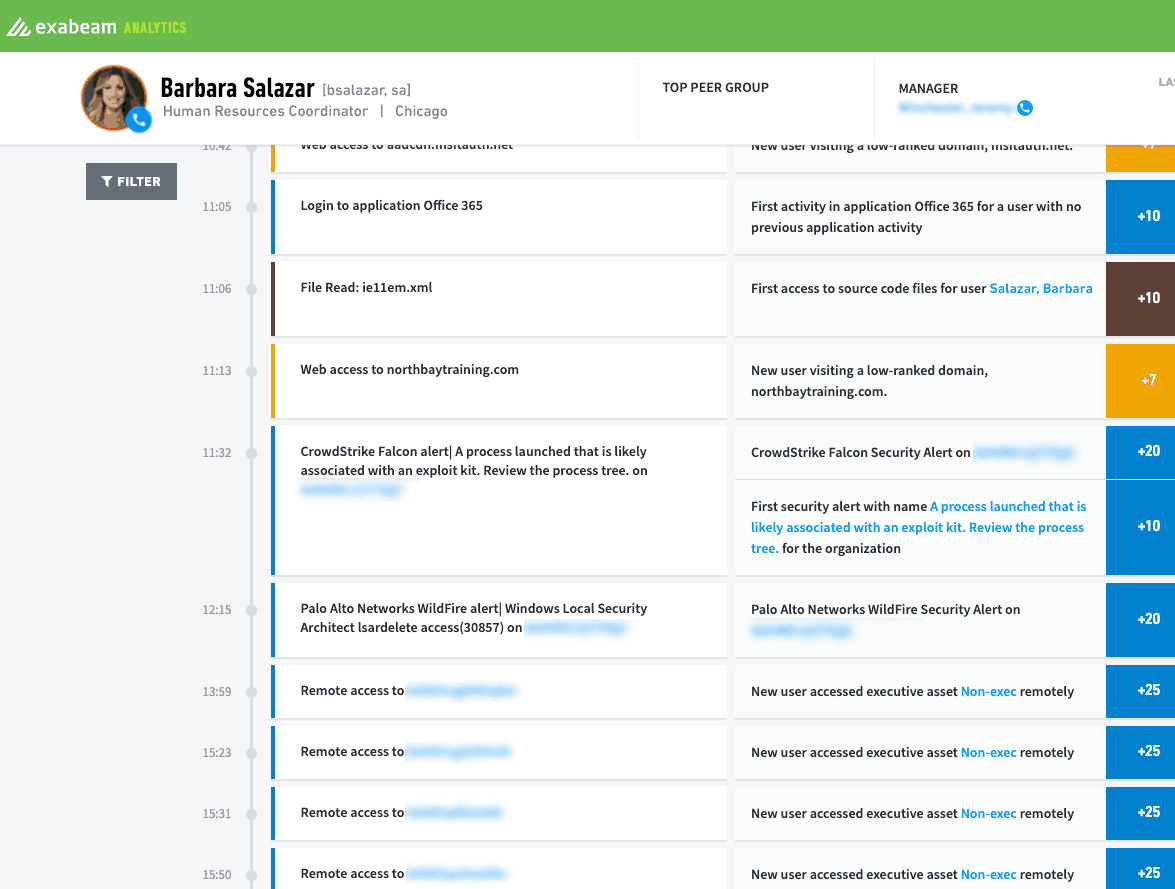
Figure 6: Drill down into the anomalies of a user’s sessions to see activities before, during and after the event.
Hours of work, potentially requiring access to multiple third-party security tools and the SIEM are now front and center on my screen in just minutes.
All the details required to see what took place are included in the data presented in the timeline:
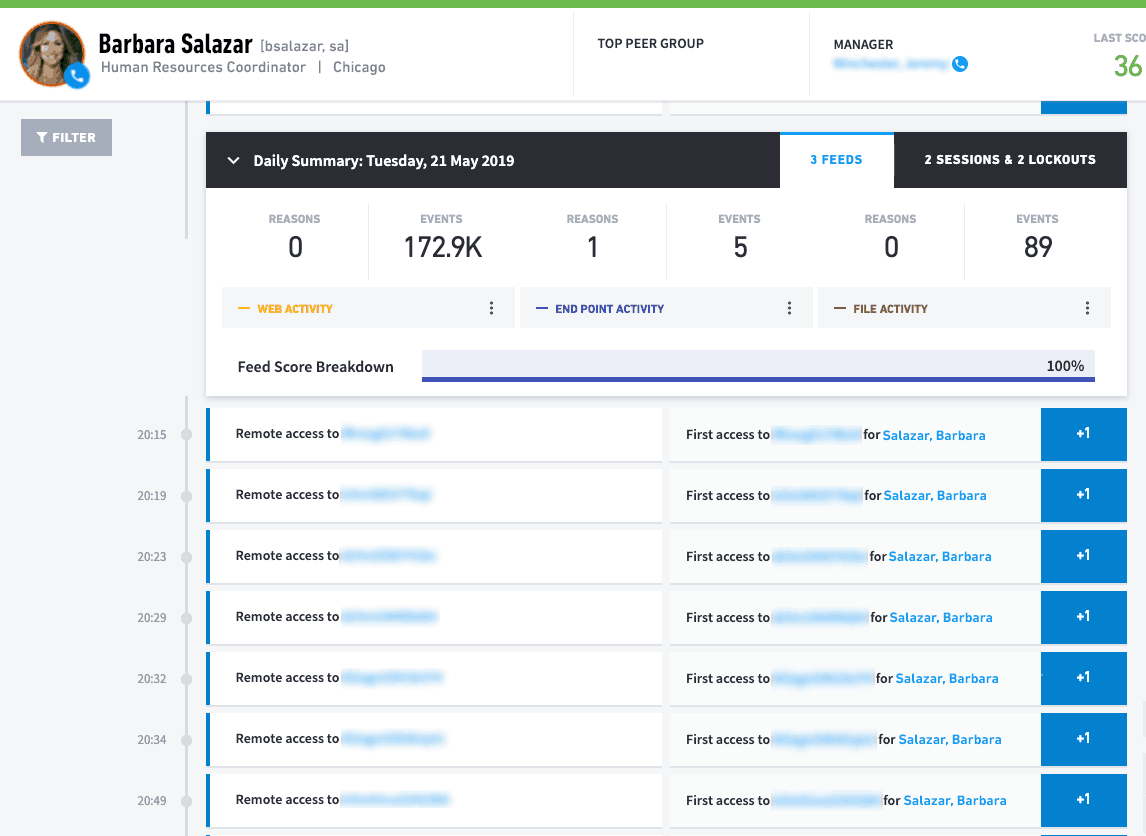
Figure 7: All the information for the security event triggered by the user is presented in detail.
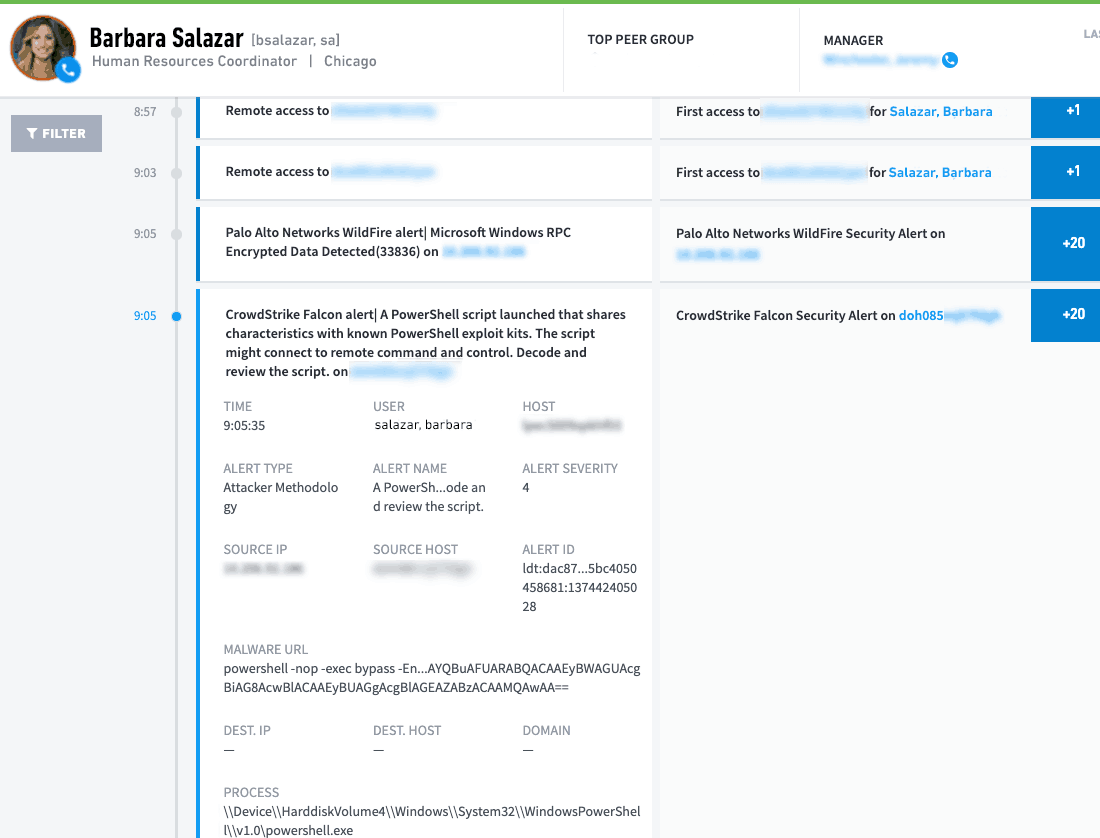
Figure 8: Web access for user Barbara Salazar shows it’s the first time she is accessing an internet IP address in Russia.
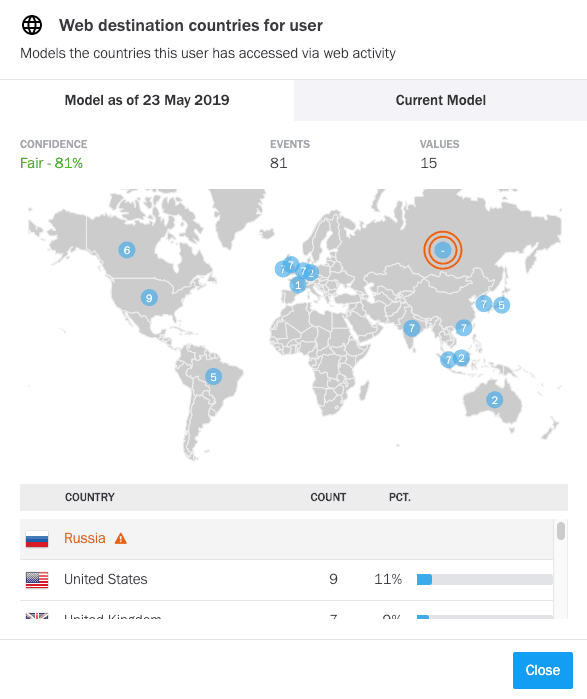
Figure 9: Exabeam Advanced Analytics pinpoints the geographical location of the IP address.
All the elements of a page-turner
Over the course of the next week or so, this story played out with our user moving laterally all across the organization, running PowerShell in execute mode, connecting to executive admins’ systems, and generally doing everything a real hacker would do.
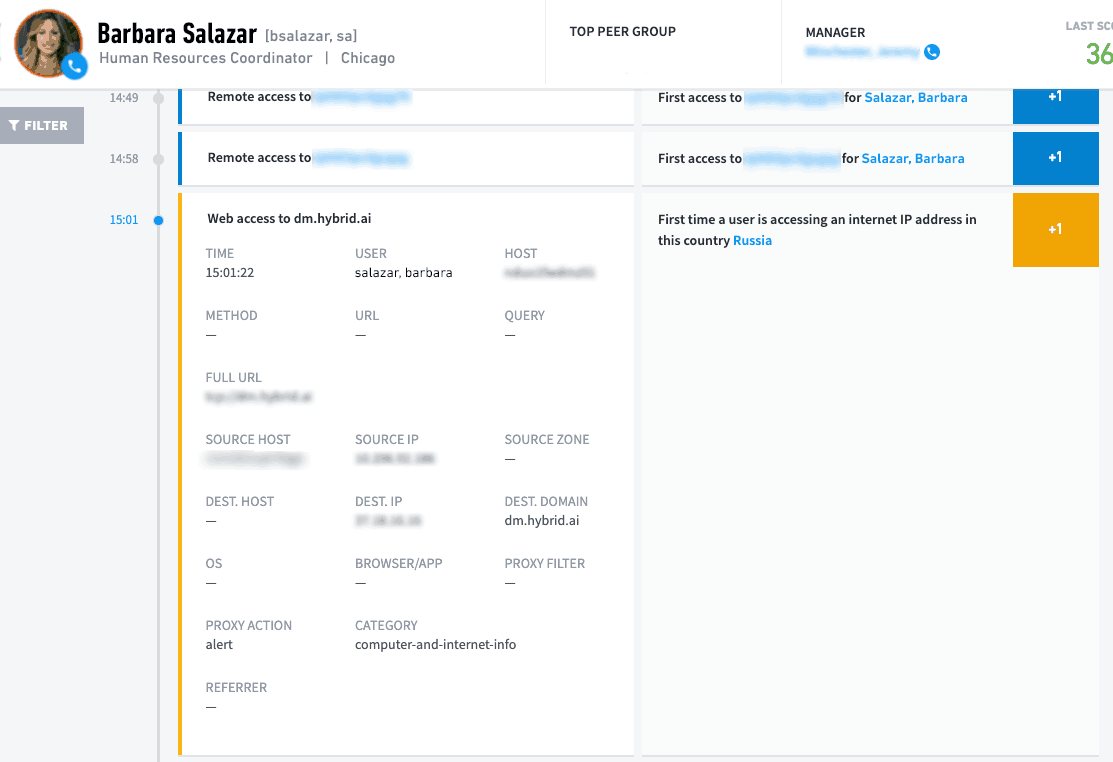
Figure 10: Exabeam provides full analytics on the event and presents evidence for reporting.
Good thing this was actually a red team exercise. Exabeam Advanced Analytics caught this on day one and allowed the analyst team to sit back and watch while the platform gathered evidence to present to the Red Team during their review.
Exabeam analytics reported exactly what was happening while the SIEM showed no anomalies. It’s not that the events weren’t there – they were. It’s that there was no system to piece everything together into a complete story. Exabeam Advanced Analytics and Smart Timelines told the whole story, which is critical to understanding and reacting in a timely manner to emerging security threats.
Learn More About Exabeam
Learn about the Exabeam platform and expand your knowledge of information security with our collection of white papers, podcasts, webinars, and more.
-
 Blog
Blog
What’s New with New-Scale in October 2025: Measurable, Automated, Everywhere Security Operations
- Show More


